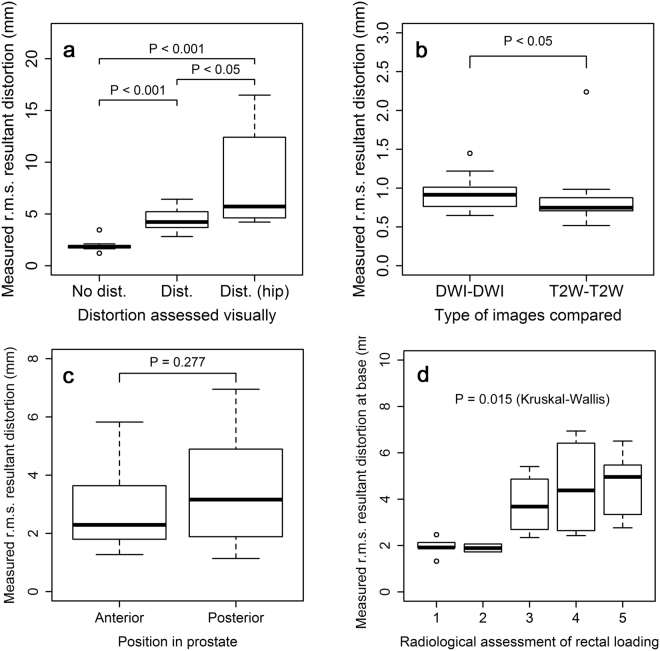
Figure 4.
Box plots of measured values of resultant distortion (mm). (a) between three groups of patients: ‘distorted DWI’ and ‘non-distorted DWI’ as assessed by a radiologist, and a third group of patients with hip prostheses, most showing evidence of ‘severe warping’ in DWI; (b) within the control groups testing intra-observer repeatability (for both DWI and T2W images); (c) on DWI images by position in prostate (anterior vs posterior); and (d) on DWI images at base of prostate by degree of rectal loading as assessed by a radiologist on a Likert scale of 1 (none) to 5 (significant rectal loading).

