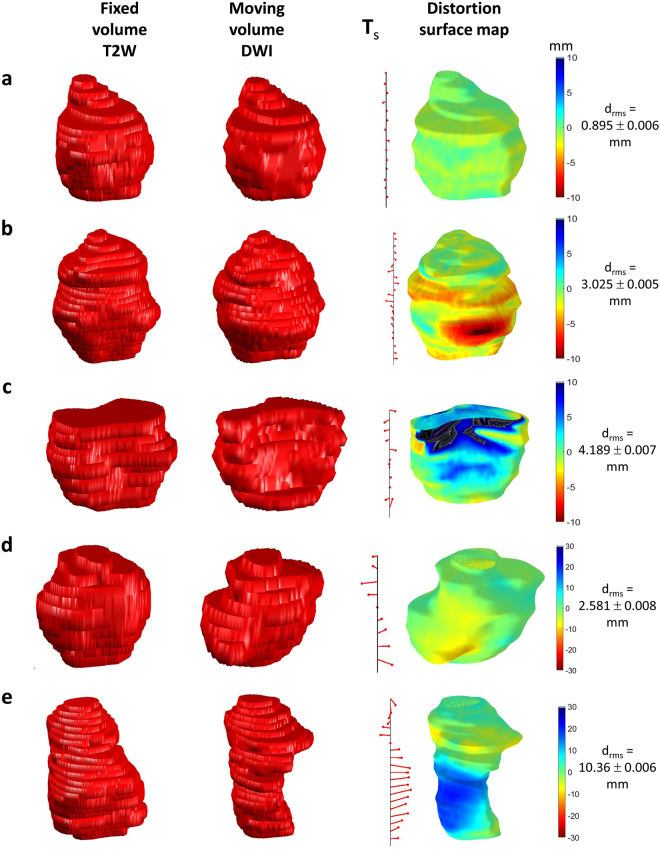
Figure 5.
Sample distortion maps for DWI of patients referenced to T2-weighted imaging. (a) An example of little apparent distortion; (b) positive distortion i.e. ‘bulges’ in DWI volume; (c) negative distortion i.e. recesses in DWI volume; (d) patient with hip replacement, but comparatively little DWI distortion (however, note change in colour scale); (e) as (d) but showing large distortions caused by susceptibility effects. See Supplementary Video S1 for multi-orientation views of the distortion surface map shown in (d).

