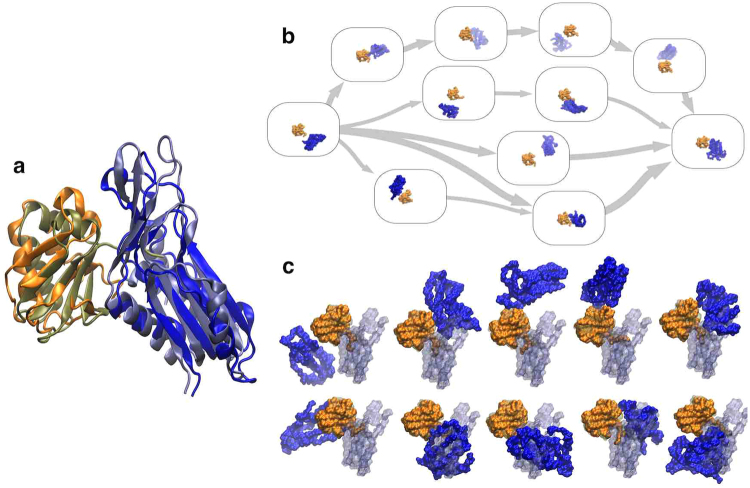
Figure 6.
Results from MoaD and MoaE association simulations. (a) Superposition of the predicted active structure predicted by selecting the frame with the lowest sum of distances between evolutionary coupled residues with the crystal structure (PDB ID: 1FM061). The backbone RMSD between the two structures was 6.4 Å. (b) The five most probable pathways between the state containing the initial separated structure and the state containing the near-crystal structure conformation determined using TPT in the MSMExplorer application69. Randomly chosen structures from each state are displayed in the state boxes. (c) Randomly chosen structures from the ten states with the highest stationary probabilities calculated from the MSM transition matrix. The crystal structure is superimposed over each structure in a transparent representation for comparison.

