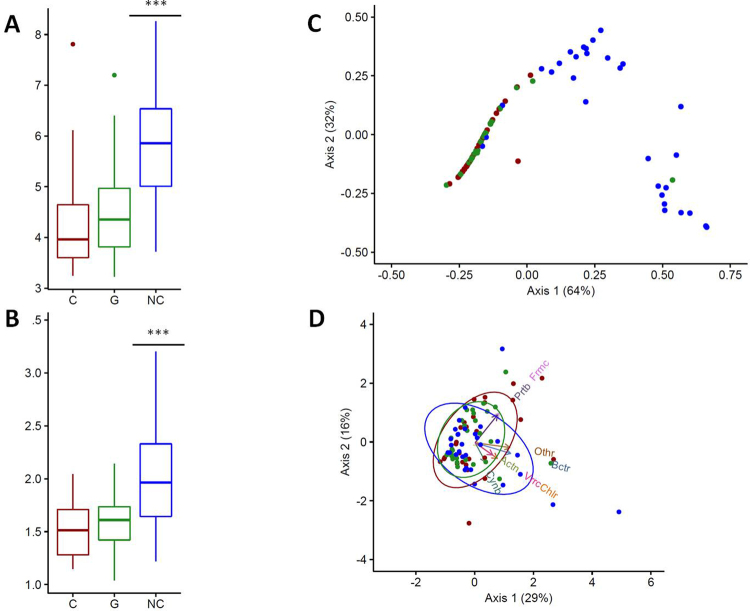
Figure 4.
Genetic background affects the diversity and structure of the bacterial communities of larvae. (A) Alpha diversity and (B) Simpson’s index of evenness for each group of larvae (C: cancerous; G: non-cancerous; NC: control). (C) Principal coordinates analysis and (D) principal component analysis for each group of larvae. Blue dots represent control individuals, green dots non-cancerous individuals, and red dots cancerous individuals. In (D), arrows show the contribution of each principal phylum to the dimensions (Actn: Actinobacteria, Bctr: Bacteroidetes, Chlr: Chloroflexi, Cynb: Cyanobacteria, Frmc: Firmicute, Prtb: Proteobacteria, Vrrc: Verrumicrobia). Ellipses consider normal data. ***p-value < 0.0001.

