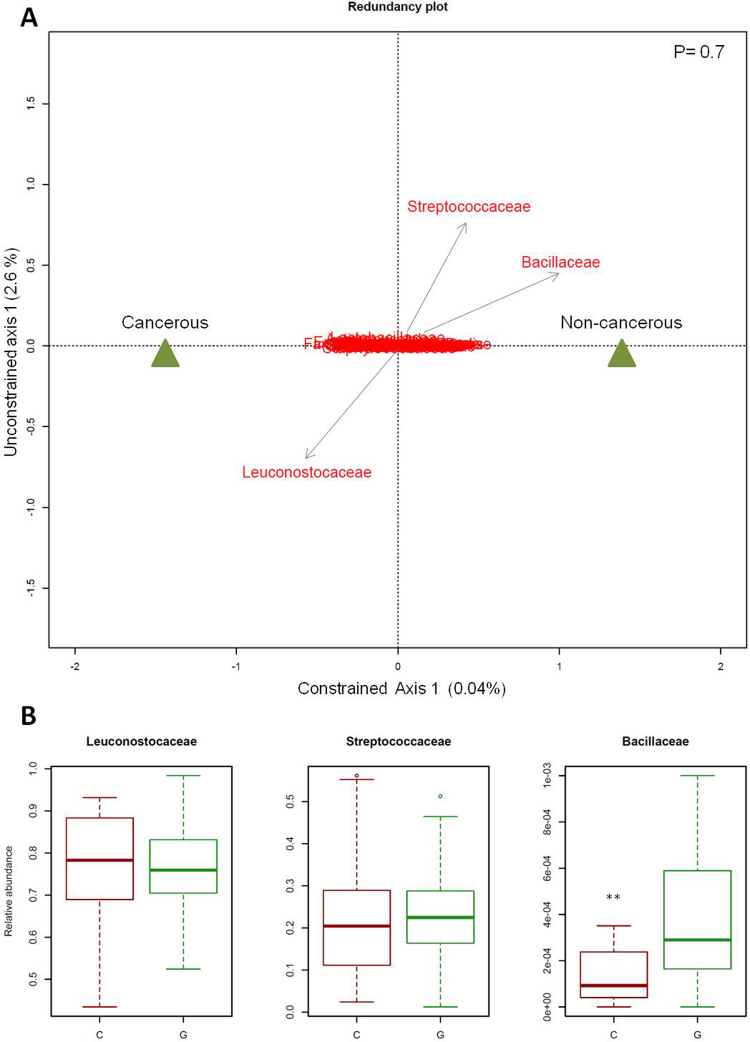
Figure 5.
Influence of cancerous status on bacterial microbiota. (A) Biplot of the redundancy analysis considering constrained ordination model based on the relative abundance of operational taxonomic units (OTUs) (97% similarity level). OTUs with a relative abundance superior to 0.02% are indicated in red. The triangles show the centroids for factor constraints. The p-value of the Monte Carlo Permutation Test is shown in the upper right. (B) Relative abundance of three families of interest in the cancerous (C) and non-cancerous (G) groups. **p-value < 0.001.

