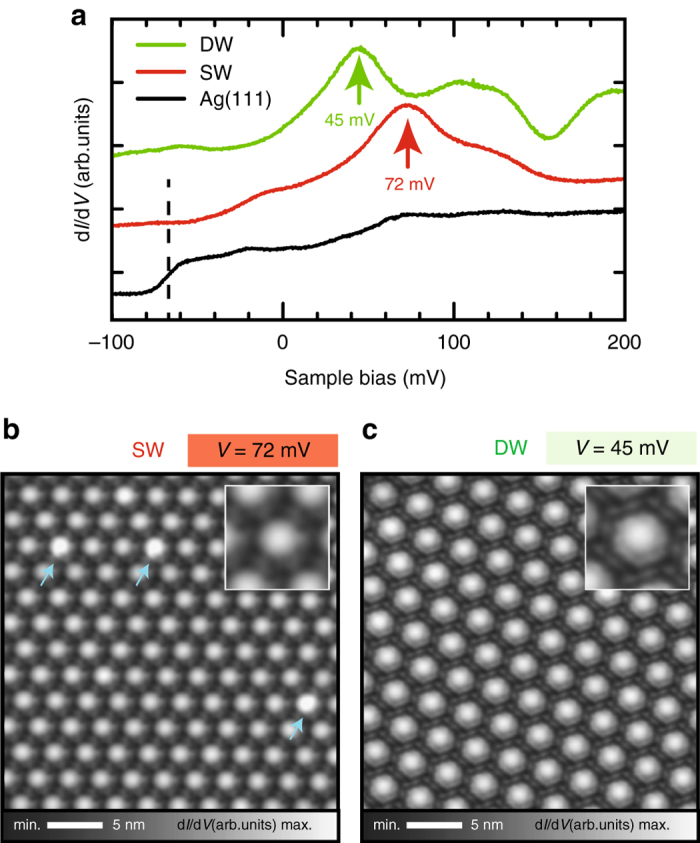
Fig. 2.

Local electronic structure of the SW and DW networks. a Conductance (dI/dV) spectra on the pristine Ag(111) (black), on the pore centers of the SW network (red) and DW network (green). b, c dI/dV maps on the SW and DW networks acquired on the peak maxima in a, enlarged in the corresponding insets. Measurement parameters: I = 10 pA, V = 72 mV, modulation voltage V ac = 10 mV, oscillation frequency f ac = 513 Hz (b); I = 10 pA, V = 45 mV, V ac = 10 mV, f ac = 515 Hz (c).
