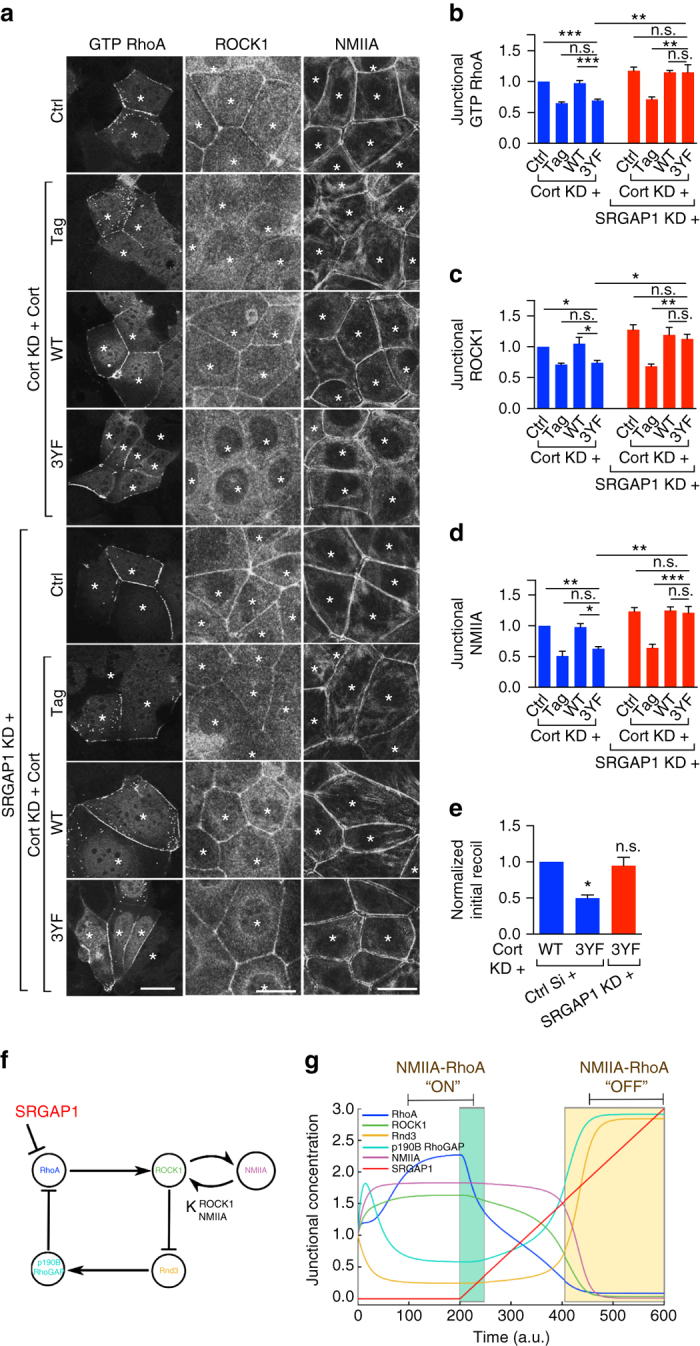
Fig. 5.

Tyrosine non-phosphorylated cortactin downregulates junctional RhoA and contractility via SRGAP1. a Representative confocal images of the apical junctional GTP RhoA (assessed by GFP-AHPH), ROCK1, and NMIIA in controls (ctrl) and cortactin shRNA cells (KD) reconstituted with fluorescence-tagged WT or 3YF cortactin (indicated by the asterisks). SRGAP1 was depleted by siRNA (SRGAP1 KD). ROCK1 and NMIIA images are maximum projection views of the three apical-most sections. b–d Quantification of junctional GTP RhoA (b), ROCK1 (c), and NMIIA (d) from the conditions of a. e Junctional initial recoil velocities in Caco-2 cells (also see Supplementary Fig. 6c). N = 3 independent experiments, data are means ± s.e.m.; one-way ANOVA with Dunnett’s post hoc analysis; n.s., not significant; *p < 0.05; **p < 0.01; ***p < 0.001. Scale bars = 25 μm. f Model of SRGAP1 as an antagonist orthogonal to junctional NMIIA-RhoA feedback network. Arrows and T-junctions represent stimulation and repression, respectively. g The network shown in f was mathematically modeled as a system of pairwise stimulators or repressors of junctional localization (Supplementary Information). All junctional concentrations were initialized to one and shown across time except for SRGAP1, which was initialized to 0. At time t = 200, a linear increase in the concentration of SRGAP1 (0.0075 per time units) was included in the simulations
