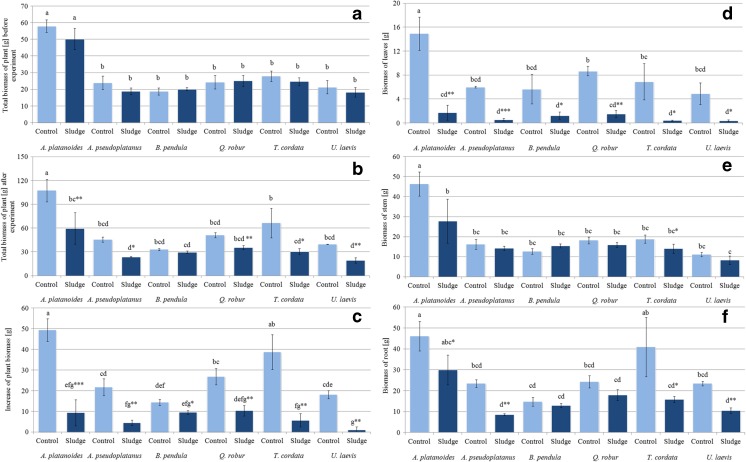
Fig. 1.
Total plant and organ biomass (g) of tree species grown in soil (Control) and mining sludge (Sludge). Mean values (n = 3); identical superscripts (a, b, c…) denote no significant (p < 0.05) difference between mean biomass of all observations (separately for each organ of all control and treated tree species), according to Tukey’s HSD test (ANOVA); statistically significant differences between mean biomass of particular control and tree species treated with the t test are indicated by an asterisk

