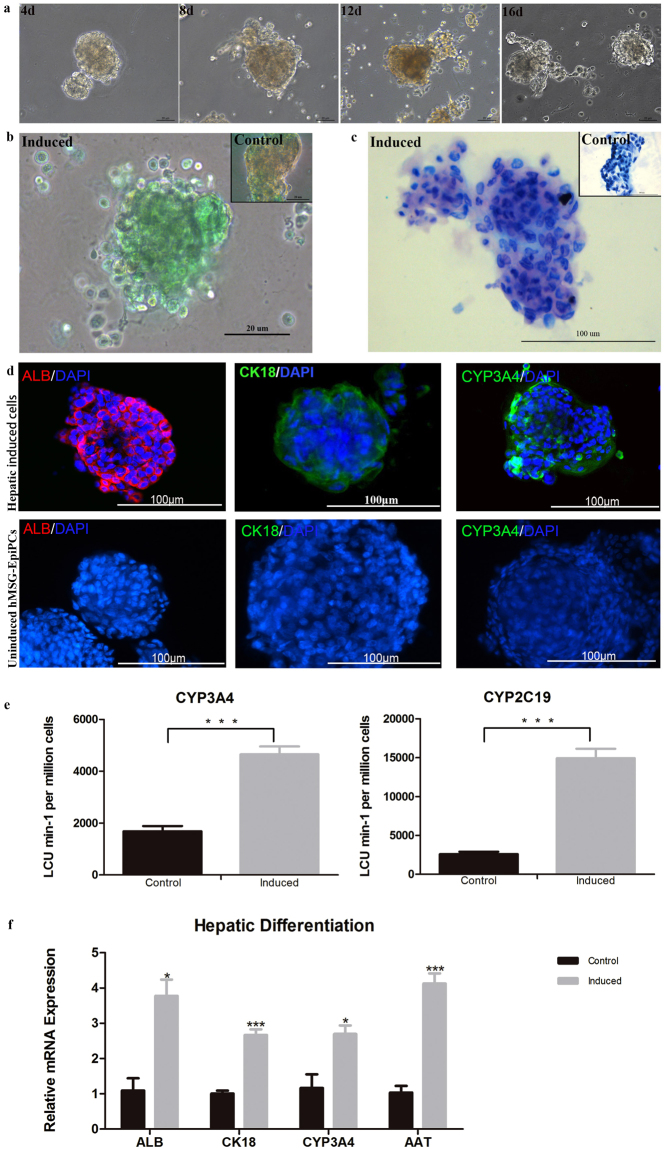
Figure 2.
Hepatic differentiation of hMSG-EpiPCs in vitro. (a) Picture of induced hMSG-EpiPCs taken on day 4, 8, 12 and 16 from left to right. (b) Indocyanine green (ICG) uptake assay on day 16 of hepatic induction and the control group. (c) Periodic acid-Schiff (PAS) staining on day 16 of hepatic induction and the control group. (d) Immunostaining on day 16 of hepatic induced and uninduced cells for ALB, CK18 and CYP3A4 from left to right. (e) CYP450 activity analysis on day 16 of hepatic induction for CYP3A4 and CYP2C19. (f) Quantitative real-time PCR analysis of relative mRNA expression of hMSG-EpiPCs and induced hepatic cells on day 16. (***P < 0.01; n ≧ 3).

