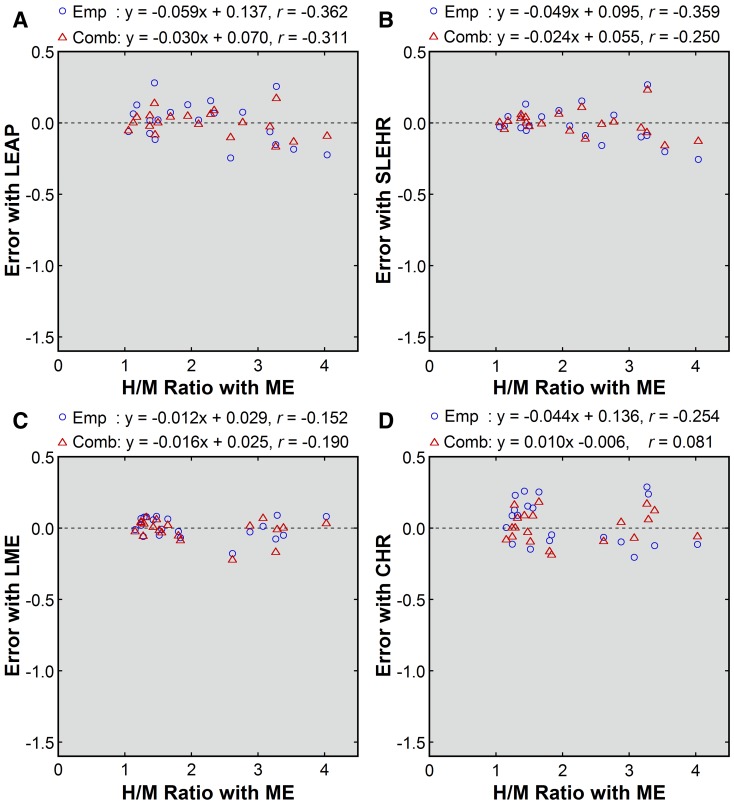
Figure 5.
Errors after point-source-based correction (A, LEAP; B, SLEHR; C, LME; D, CHR) collimators. Errors after empiric correction (blue circle) and combined correction (red triangle) were plotted against the uncorrected H/M ratios obtained with the ME collimator. Results of linear regression are shown

