Figure 1.
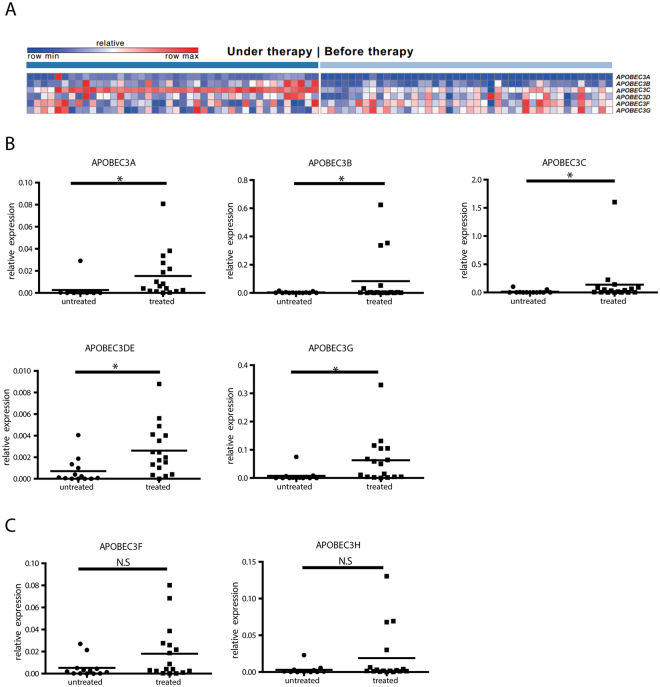
mRNA expression of APOBEC3 family members in liver biopsies of patients treated with IFN. (A) Meta analysis of transcription levels of APOBEC3 family members, in two studies reporting hepatitis C patients under IFN treatment13,14. The top scaled color bar indicates the relative gene expression level, and the dark and light blue bars illustrate two groups of patients: under and before therapy. In the heatmap, each column contains the data from one patient, and each square shows the gene expression level in a specific individual. All changes had FDR(BH) <0.01 and p after Bonferroni correction <0.05. More details for all six genes are summarized in Supplementary Table 3. (B,C) Total RNA from liver biopsies of naïve- or IFN-α-treated CHB patients were extracted. After reverse transcription, mRNA expression levels of APOBEC3A, -B, -C, -D/E, -G (B), -F, and -H (C) were quantified and normalized to GAPDH mRNA. Student’s t test was used to compare the two groups. *P < 0.05; N.S. no significance.

