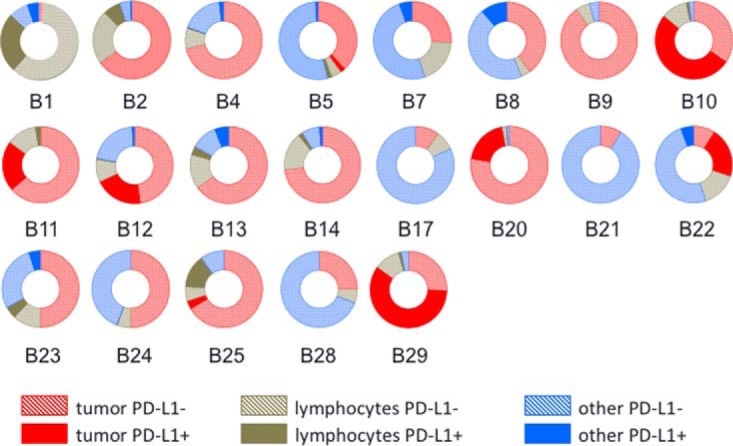
Fig. 1.

Cellular composition and IHC PD-L1-positive fraction of cell classes in 22 melanoma samples. Donut plots indicate tumor cells (red), lymphocytes/histiocytes (dark green) and other cell types (blue). Solid color indicates PD-L1 positive cells, hashed color indicates PD-L1 negative cells. Detailed composition of cell components and cell types that comprise the “other cell types” category are provided in supplemental Table S4.
