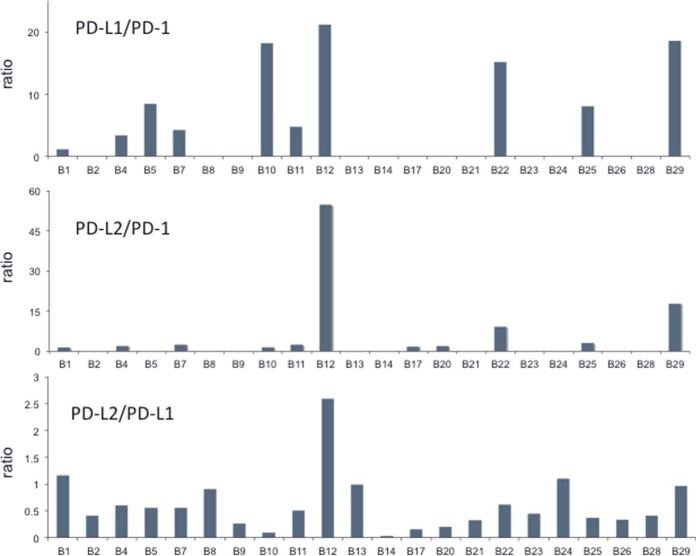
Fig. 4.
Abundance ratios for PD-L1:PD-1 (upper panel), PD-L2:PD-1 (middle panel) and PD-L2:PD-L1 (lower panel) in 22 melanoma samples measured by MS. Ratios are presented only for samples in which both proteins were quantifiable above the LLOQ. Calculated ratios are shown in supplemental Table S7.

