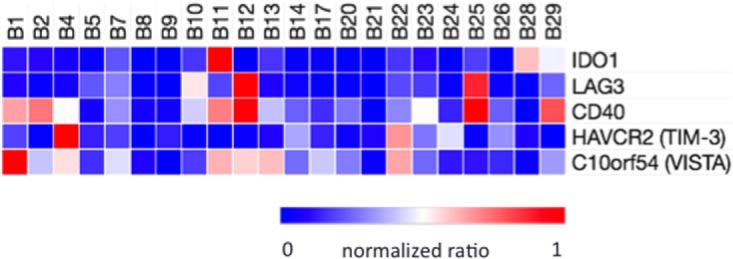
Fig. 6.

Heatmap representation of relative quantitation of IDO1, LAG3, HAVCR2 (TIM-3), C10orf54 (VISTA) and CD40 by LRP PRM analysis of proteotypic peptides. Signals from the three most abundant PRM transitions for each target peptide were normalized to integrated signal for the three most abundant transitions for an LRP peptide present in the same bRPLC fraction. The bRPLC fractions, LRP peptides and transitions are presented in supplemental Table S2.
