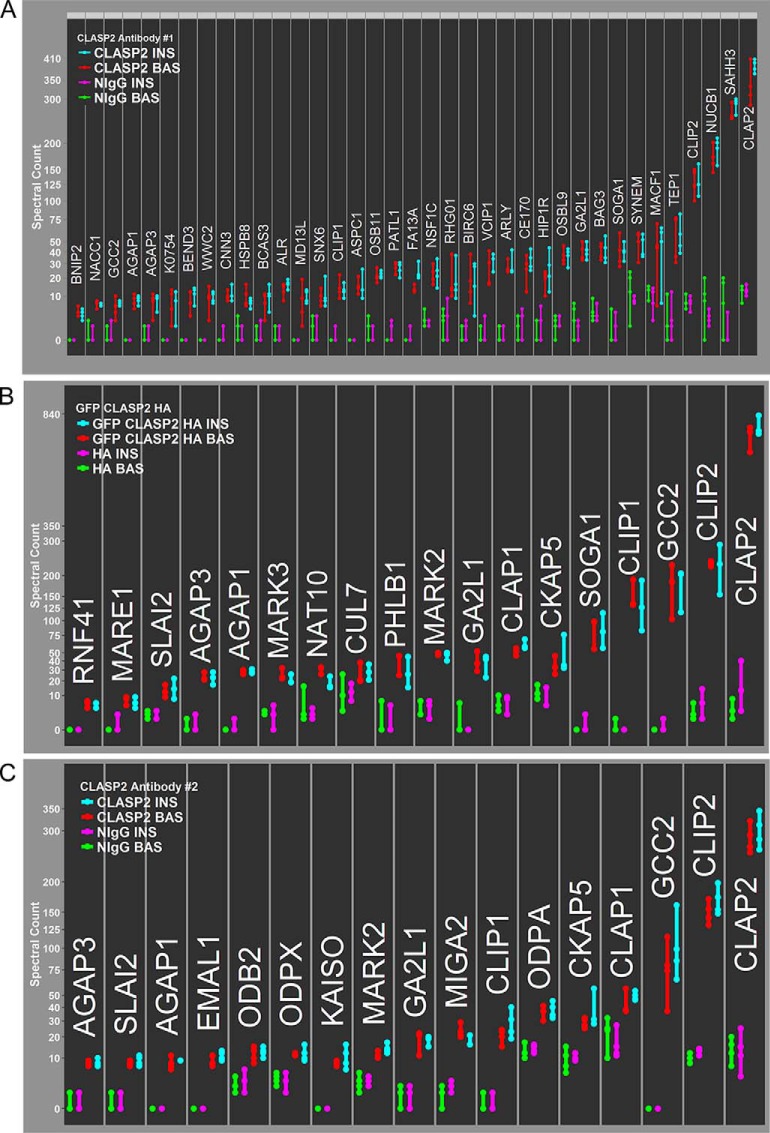
Fig. 2.
SAINT scoring and Spectrum Count Profile analysis of the CLASP2 interactomes. A, For the CLASP2 Antibody #1 IP experiments, the 39 “SAINT-qualified” proteins were ordered in a hierarchical manner, from lowest spectrum counts identified (BNIP2) to highest (CLAP2), and results from all four experiments were individually plotted in a Spectrum Count Profile (“SCP”). Basal NIgG IPs (green), insulin NIgG IPs (magenta), basal CLASP2 Antibody #1 IPs (red), and insulin CLASP2 Antibody #1 IPs (turquoise). B, Anti-HA antibody IPs for GFP-CLASP2-HA were performed as described in Fig. 1. Tandem mass spectrometry on the IPs was performed as described under Experimental Procedures (n = 3) and SCP analysis of the 18 SAINT-qualified proteins is shown. C, CLASP2 Antibody #2 IPs were performed as described in Fig. 1. Tandem mass spectrometry on the IPs was performed as described under Experimental Procedures (n = 4) and SCP analysis of the 17 SAINT-qualified proteins is shown.

