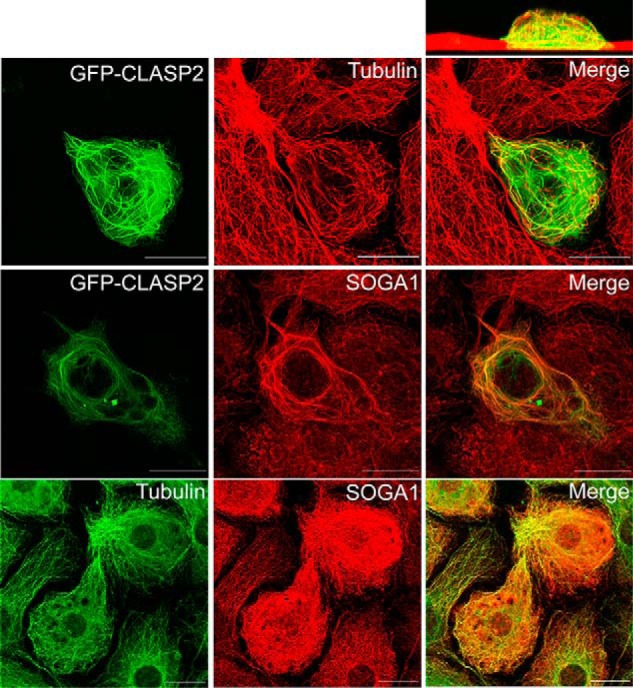
Fig. 7.

Identification of SOGA1 as a microtubule associated protein. Adipocytes infected with GFP-CLASP2-HA adenovirus were imaged for GFP to visualize CLASP2 (top row, first panel) and immunostained for tubulin to visualize microtubules (top row, middle panel). These images were merged (top row, third panel) and a cross-sectional view of the z-plane is shown (above the third panel of the top row). Adipocytes infected with GFP-CLASP2-HA adenovirus were imaged for GFP to visualize CLASP2 (middle row, first panel) and immunostained for SOGA1 (middle row, middle panel). Adipocytes were immunostained for tubulin to visualize microtubules (bottom row, first panel) as well as SOGA1 (bottom row, second panel).
