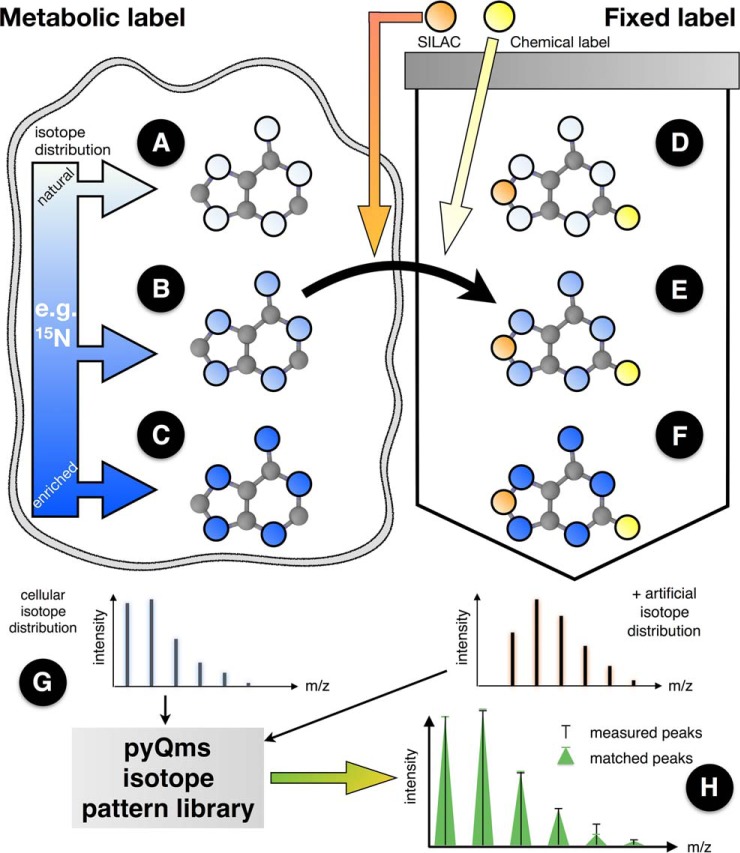
Fig. 1.
Labeling strategies employed in mass spectrometry separated into metabolic (left) and fixed labels (right). Metabolic labeling (e.g. 15N salt or 13C sugar) is metabolized in the cell and incorporated into newly synthesized molecules. The isotope distribution of the labeled element can be natural (A, white circles), partially enriched by an isotope (e.g. 15N, light blue color represents e.g. an average labeling of 60%, i.e. three of five nitrogens are 15N) as observed during pulse or pulse-chase experiments (B, light blue) or fully enriched (C, dark blue). Fixed labels are incorporated into or attached to the molecule during or after the synthesis steps. Fixed labeling can be performed in vivo (e.g. stable isotope labeling with amino acids in cell culture incorporation (2)) or in vitro (e.g. digestion in 18O-labeled water (45)). In both cases the element isotope distributions of the label are independent of the cellular distributions and are thus treated as different element pools (D–F). Combining different labeling strategies permits novel multiplexing strategies. Only pyQms can be used to quantify all six cases (A–F) in all variations and combinations irrespective of the label or the molecule type and to, most importantly, score the quantifications. The metabolic isotopic distribution (left isotopologue) and the artificial isotopic distribution (right isotopologue of a potential fixed label is used to calculate an accurate isotope pattern for each molecule (G). These patterns are compared with the MS measurements (H). Matches are evaluated providing the similarity match score (mScore). Black bars, measured peaks; green triangles, matched peaks; x-axes, m/z value; y-axes, intensity. For considerations on the terms fixed and metabolic labeling, please refer to the online methods.

