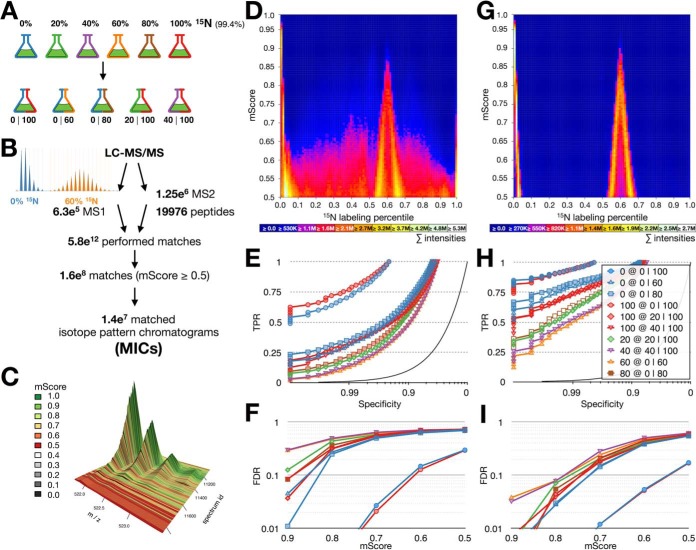
Fig. 3.
The partially labeled proteome gold standard. (A) Cultures of C. reinhardtii were grown on medium containing 20, 40, 60, 80, and 100% 15N. Each partially labeled proteome was mixed with an unlabeled (14N) or fully labeled (15N) proteome, yielding five mixed samples (0 100, 0 60, 0 80, 20 100, and 40 100). (B) Unbiased quantification workflow. All identified peptides (19,976 peptides, 18,285 distinct chemical formulas) were quantified in all MS1 spectra (6.3e5) of all LC-MS/MS runs in five charge states performing in total 5.8e12 matches. Matches were filtered using an mScore threshold of 0.5 and assembled into 1.4e7 MICs. Example isotopologues for 0 and 60% 15N incorporation are shown on the left. (C) 3D visualization of a typical MIC, colors indicate mScores for each match within the MIC; x axis, m/z; y axis, spectrum id; z axis, intensity. (D) Visual evaluation of all matches in the 0 60 sample, x axis labeling percentile, y axis mScore, heat equals summed up intensities of matches in all MS1 spectra in a given bin (representing all identified and quantified peptides in all matched charge states). (E) ROC curves of pyQms performance in all samples shown as specificity (x axis, log scale) versus true positive rate (y axis). (F) mScore-dependent FDR; x axis, mScore; y axis, FDR (log scale). (G-I) as (D-F), but quantifications are limited to retention time windows. Legends (D, E, G, H): 0% (blue), 100% (red), 20% (green), 40% (purple), 60% (orange), 80% (brown); mixtures: 0I100 (circles), 0I60 (triangles), 20I100 (diamonds), 0I80 (squares), 40I100 (reverse triangles).

