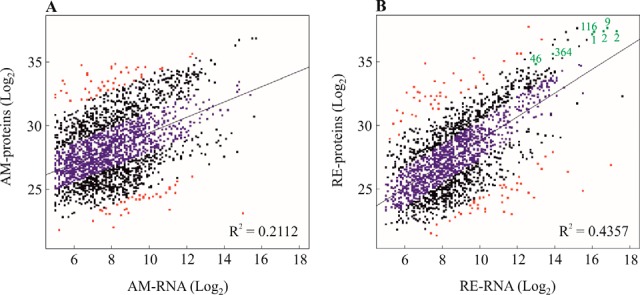
Fig. 13.

The scatter plot showing the mRNA expression levels and the abundance of proteins in amictic eggs (AM, on the left; y = 0. 60197x + 23.44552, p value < 2.2e-16) and resting eggs (RE, on the right; y = 0.9342x + 19.4816, p value < 2.2e-16). The Pearson correlation coefficients (R2) are shown on the figure. Apparent concordant proteins and RNAs are shown in blue and apparent disconcordant proteins are shown in red. The hallmark proteins of RE (in B) displaying high mRNA levels and the corresponding proteins are shown in green; 1 - protein lea- isoform k; 2- late embryogenesis abundant protein family protein; 9- alpha-crystallin a chain-like; 46- heat shock hsp20; 116- soma ferritin-like; 364- ferritin heavy chain.
