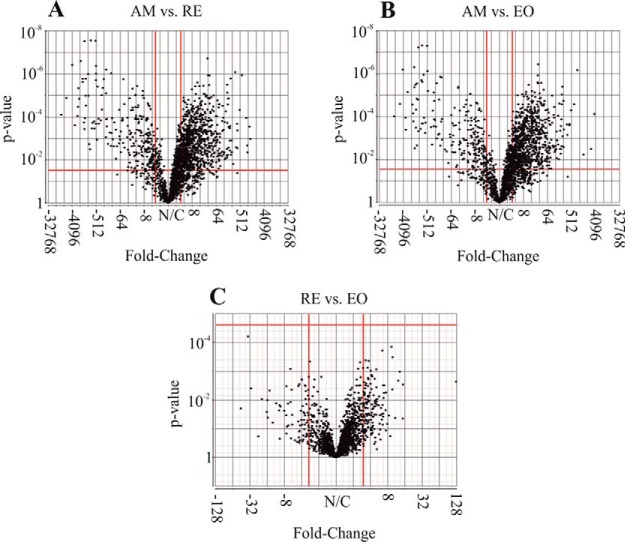
Fig. 4.
Volcano plots showing fold-change (FC) and p value per protein, in a 1-Way ANOVA of protein intensity values. Each panel shows a certain contrast included in the statistical model (AM versus RE, AM versus E0, RE versus E0). Each dot indicates a protein. The y-axis shows nominal p values. Cutoff lines (in red) indicate FDR-adjusted p value of 0.05 and FC of 3 and −3 (in linear scale). As shown, multiple proteins show significant difference in abundance in the comparison of AM versus RE and AM versus E0. However, none of the proteins passed the cutoff lines in the comparison RE versus E0.

