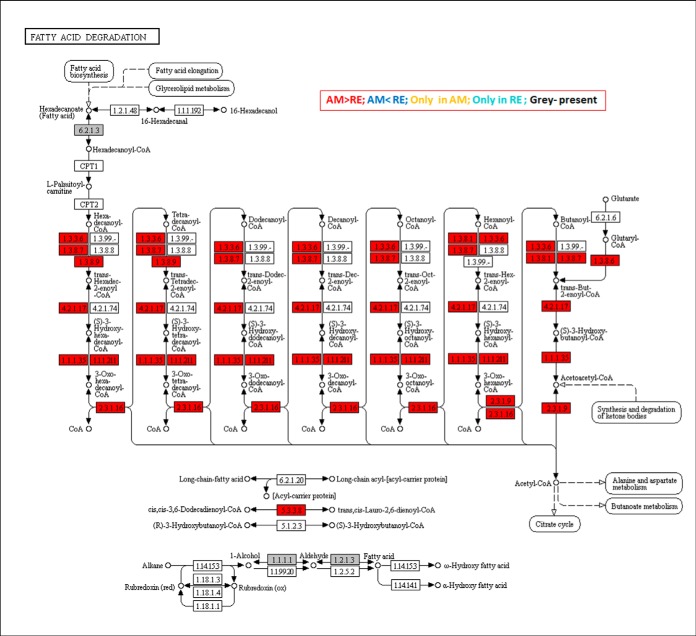
Fig. 7.
A KEGG map displaying the proteins in association with the Fatty acid degradation pathway. Boxes in gray show the proteins that were identified in rotifer eggs. Boxes in red show proteins that were significantly more abundant in AM versus RE. Statistically significant differences were indicated by 1-Way ANOVA test (FDR p value 0.05, FC>3).

