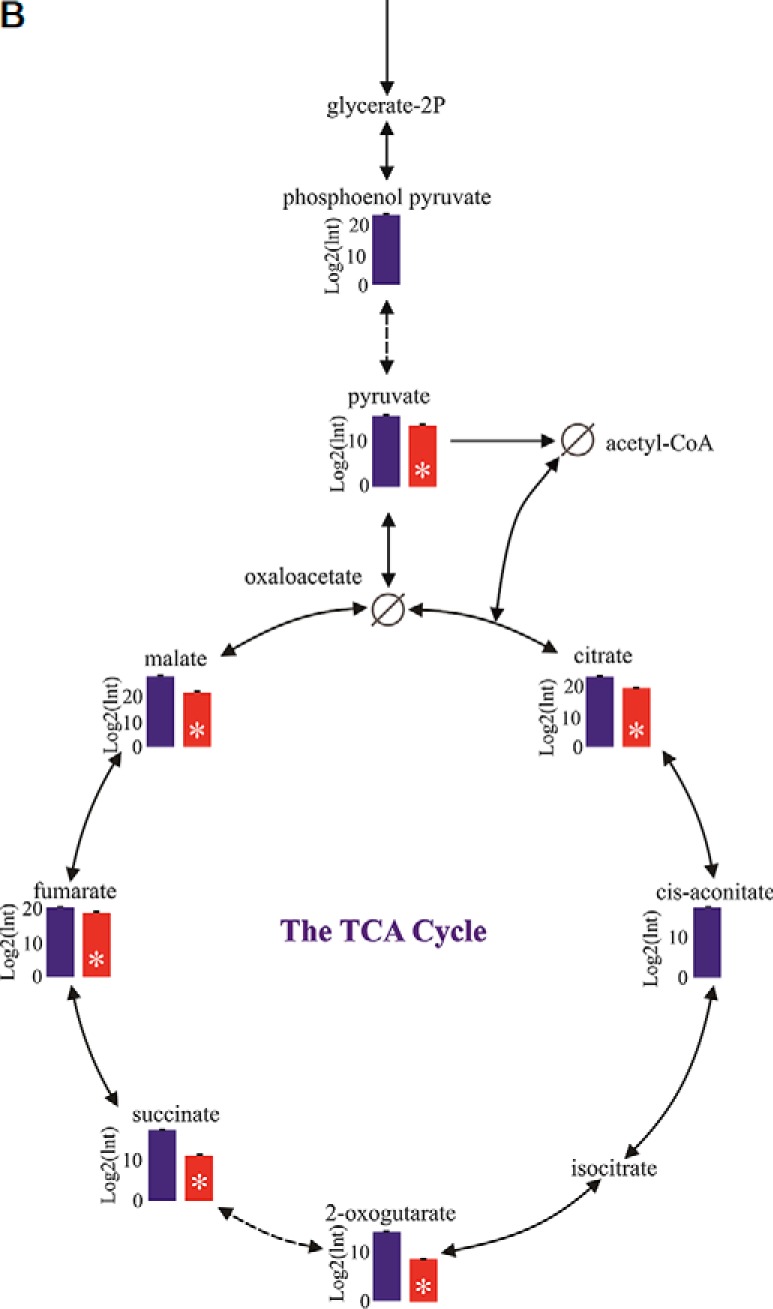
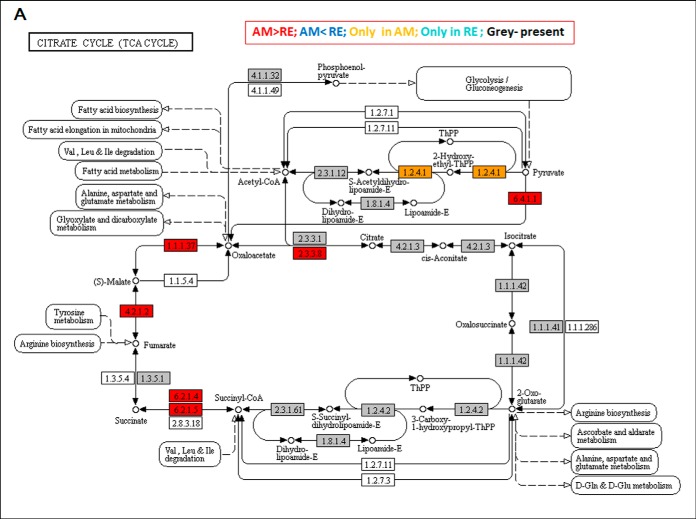
Fig. 8.

The Citrate (TCA) Cycle. A, A KEGG map showing the proteins in association with the Citrate cycle (TCA) pathway. Boxes in gray show the proteins that were identified in rotifer eggs. Boxes in red show proteins that were significantly more abundant in AM versus RE. Yellow boxes show the proteins that were detected only in AM eggs. Statistically significant differences were indicated by 1-Way ANOVA test (FDR p value 0.05, FC>3), B, A comparison of the log2 relative intensities of compounds between AM and RE, as determined by metabolome analyses. Blue columns - AM eggs, Red columns- RE. A star indicates statistical significant differences (t test; p < 0.05).

