Fig. 1.
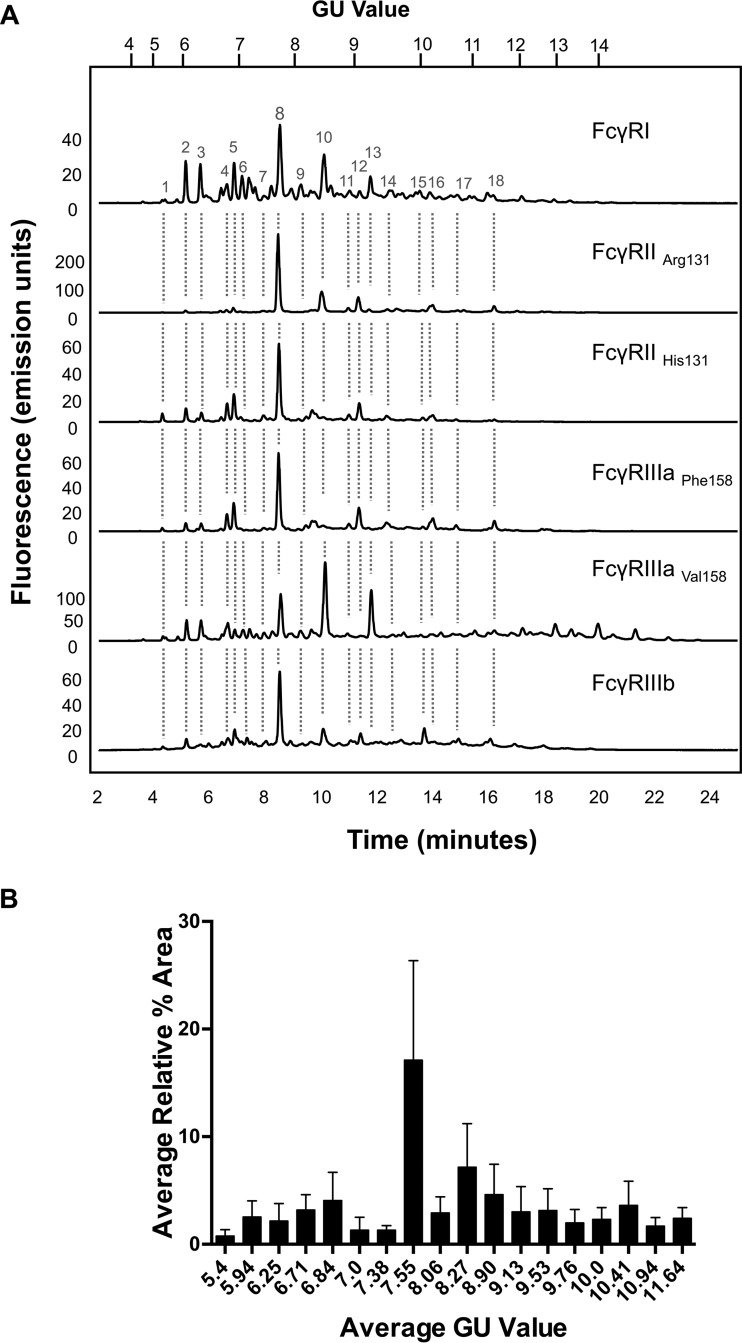
CHO expressed human FcγRs display complex and differential glycosylation. A, Glycan analysis of FcγRs expressed in CHO cells. Glycosylation of receptors was complex and differential with 30–40 unique glycan structures for each receptor. Following enzymatic release and HILIC UPLC analysis common structures (18) were identified and are indicated by dashed vertical lines. Numbered peaks represent the common glycan structures shown in Table I in red. GU values were assigned using internal 2-AB labeled dextran standards and integration using Waters Empower 3 software. Glycan structures and relative abundance for each receptor are shown in Table I. Glycan release and analysis experiments were performed in triplicate. B, FcγRs contain common N-glycans with differences in relative abundance. Average peak area percentages were calculated for peaks from individual receptors (FcγRI, FcγRIIaArg131, FcγRIIaHis131, FcγRIIb, FcγRIIIaPhe158, FcγRIIIaVal158). Eighteen common peaks were identified (see Fig. 1A) and values were plotted as the average GU value and average % area from three different releases of individual receptors. This value was then used to calculate the average value across the range of receptors for each peak to show the distribution in relative abundance between different receptors. Error bars represent the standard deviation for the relative % areas. Large error bars as seen for certain peaks e.g. GU 7.55 (FA2G2) signifying large differences in abundance for certain glycans between receptors. N-glycan structures corresponding to the GU values shown can be seen in red in Table I.

