
Fig. 4.
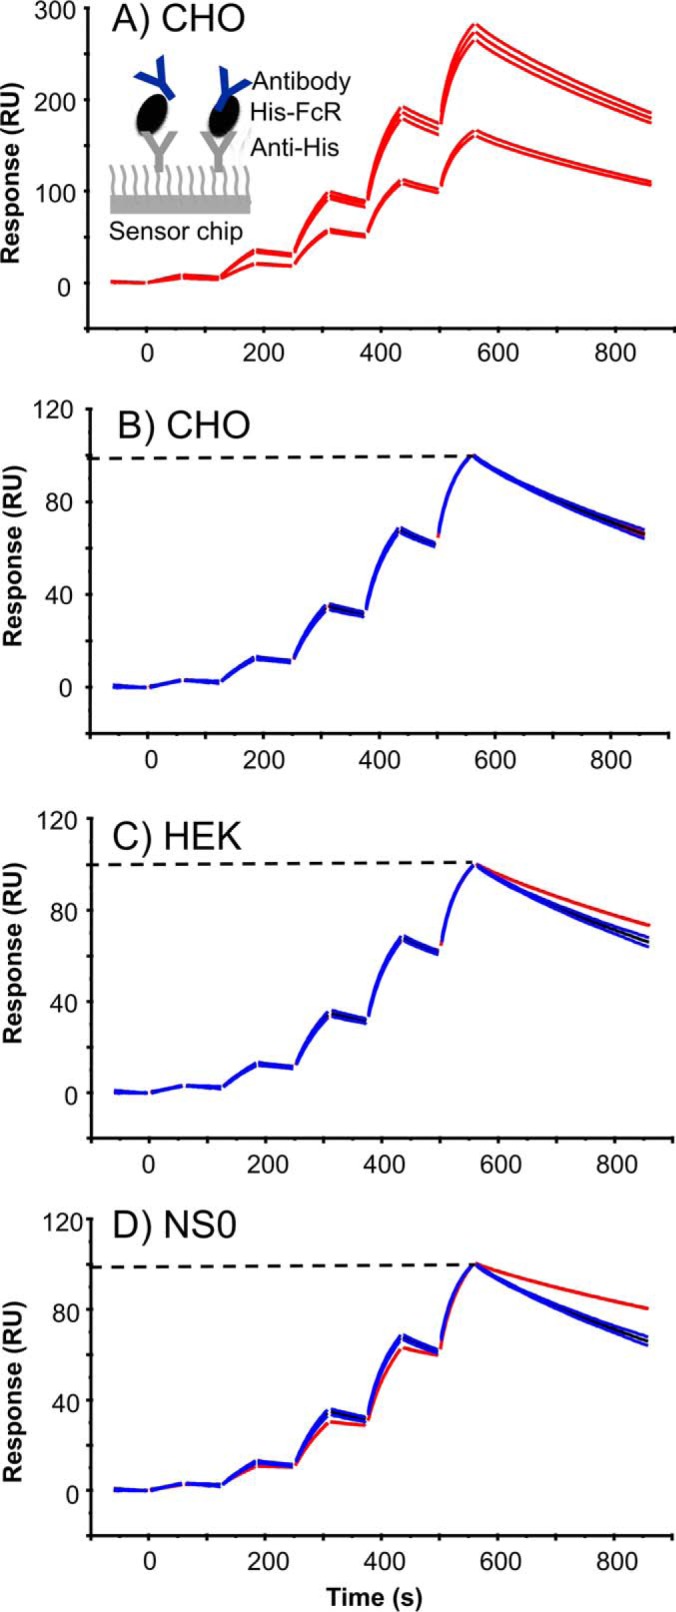
Rituximab binding kinetics depends on the source and glycosylation of FcγRI. Rituximab binding to FcγRI from CHO, HEK293 and NS0 cells is compared; using CHO expressed receptor as the standard. A, Experimental variation (n = 5) of rituximab (1.2, 4.7, 18.8, 75, and 300 nm) binding to two different levels of captured CHO-FcγRI (110 and 210 RU). B, Rituximab-CHO-FcγRI normalized data, used as standard. C, Rituximab-HEK-FcγRI binding (red) compared with the CHO standard. D, Rituximab-NS0-FcγRI binding (red) compared with the CHO standard. The dashed line indicates that the binding data is normalized between 0 and 100. Experimental data is shown in red, the average curve of the CHO-FcγRI standard is shown in black and the average curve standard deviation limits are shown in blue.