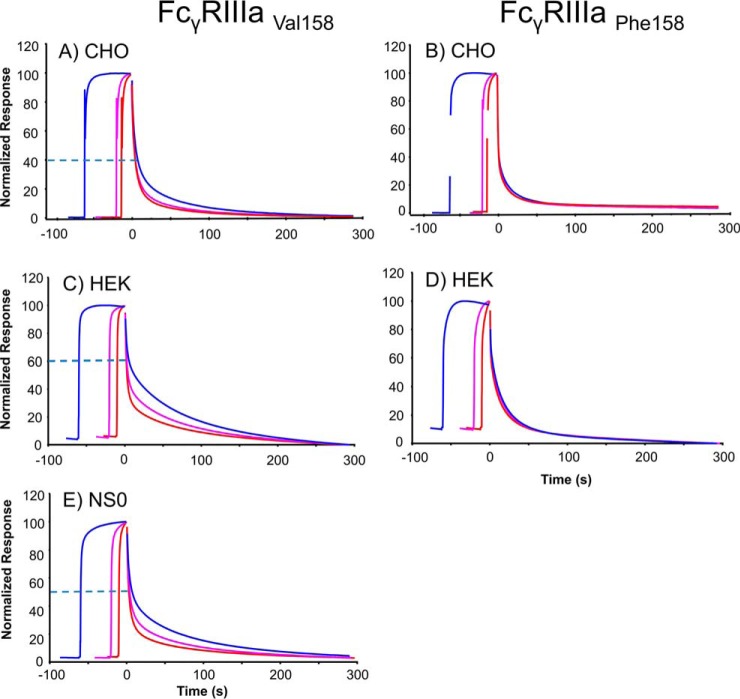
Fig. 6.
Rituximab FcγRIIIa dissociation rates depend on the interaction time and FcγR variant at saturating conditions. Saturating concentration (6 μm) of rituximab was injected over a sensor chip with ∼100 RU captured FcγRs of different types: A and B, CHO-FcγRIIIa, C and D, HEK293-FcγRIIIa. E, NS0-FcγRIIIa. Injections were performed for 10 s (red curve), 20 s (magenta curve), and 60 s (blue curve) in separate cycles ensuring that saturating levels (∼200 RU for Val 158 and 140 RU for Phe 158) were obtained for all injection times. Curves were overlaid and responses normalized between 0 and 100 and aligned at the end of the injections (time = 0). Dissociation rates were visually compared. Dashed lines indicate the level where the slower dissociation of the 60 s injection visually starts, the higher the dashed line then the larger the time effect and slower dissociation.

