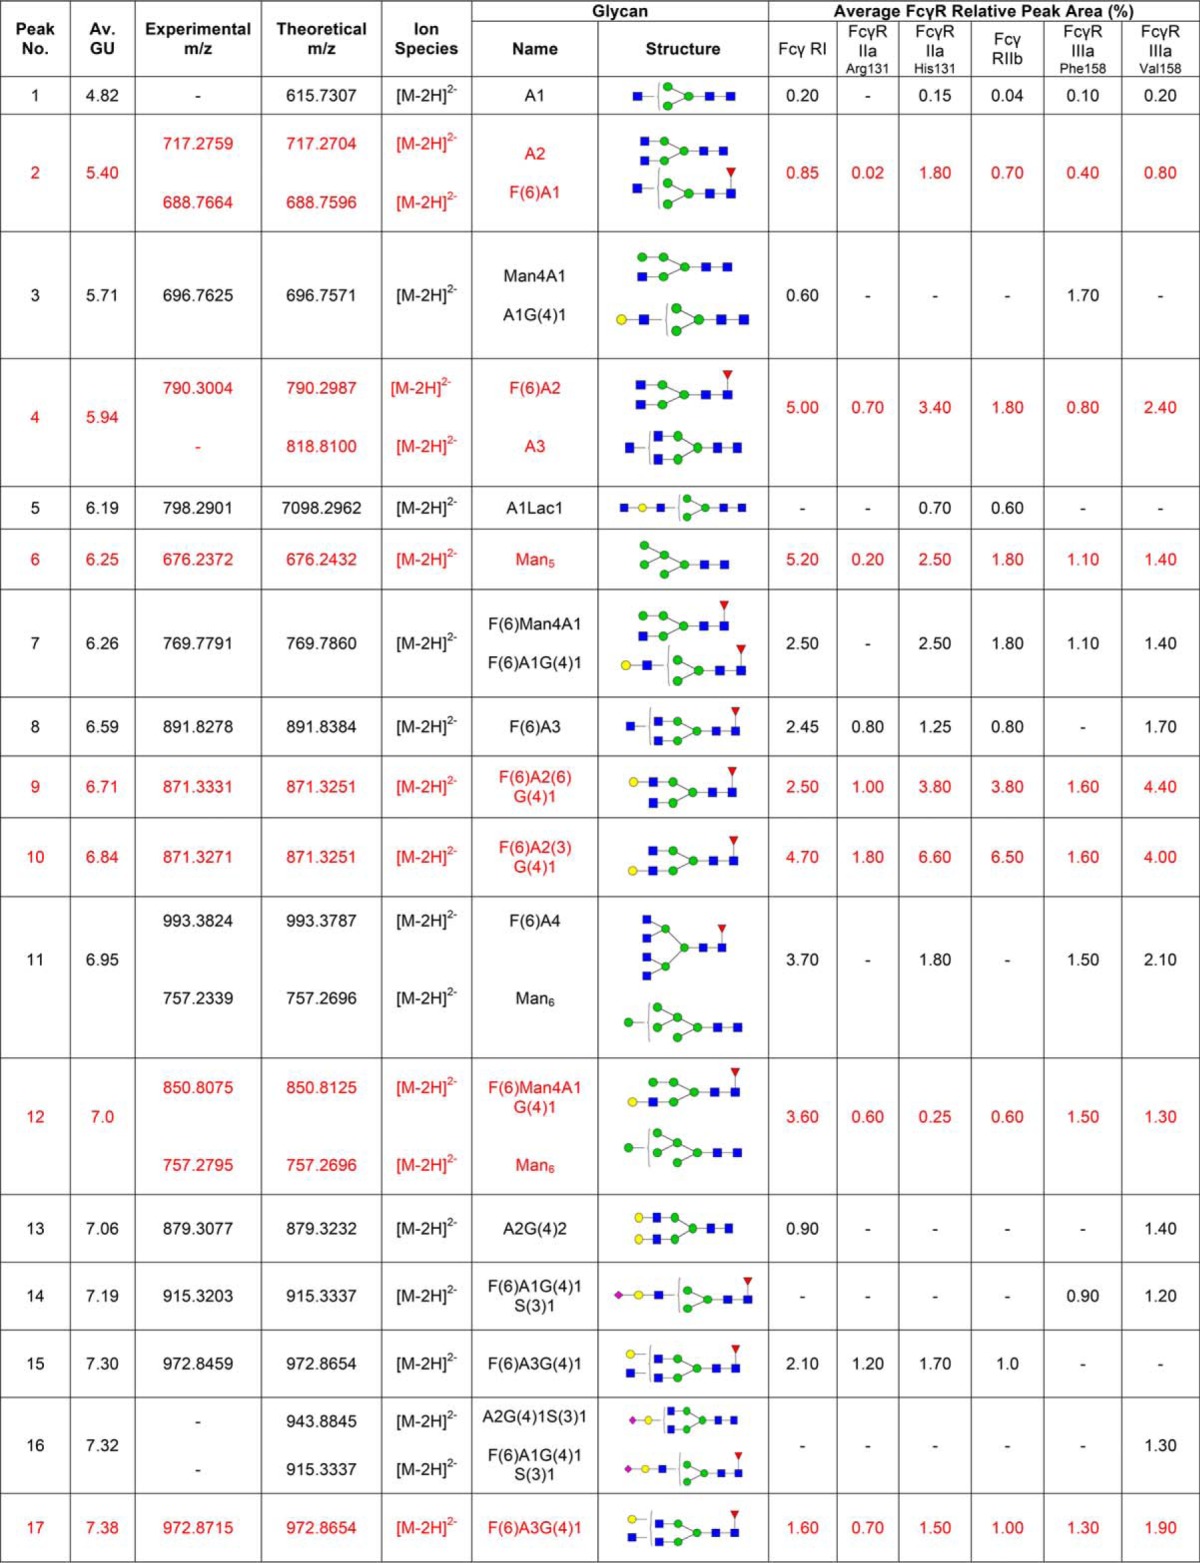
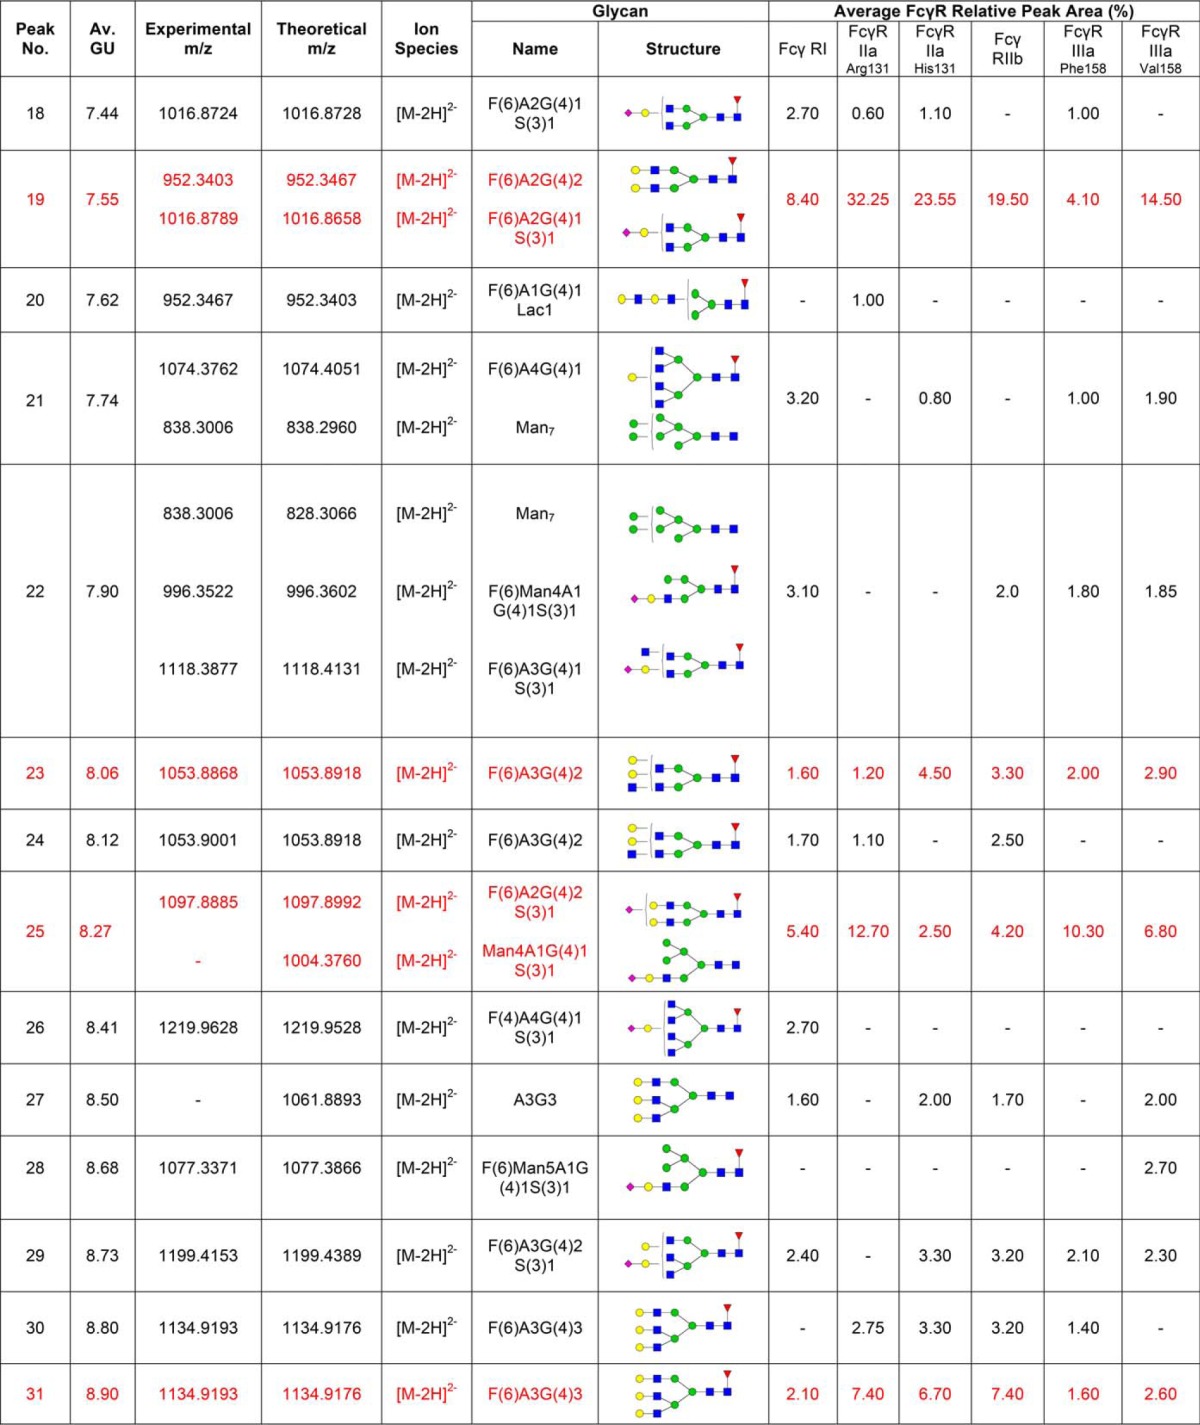
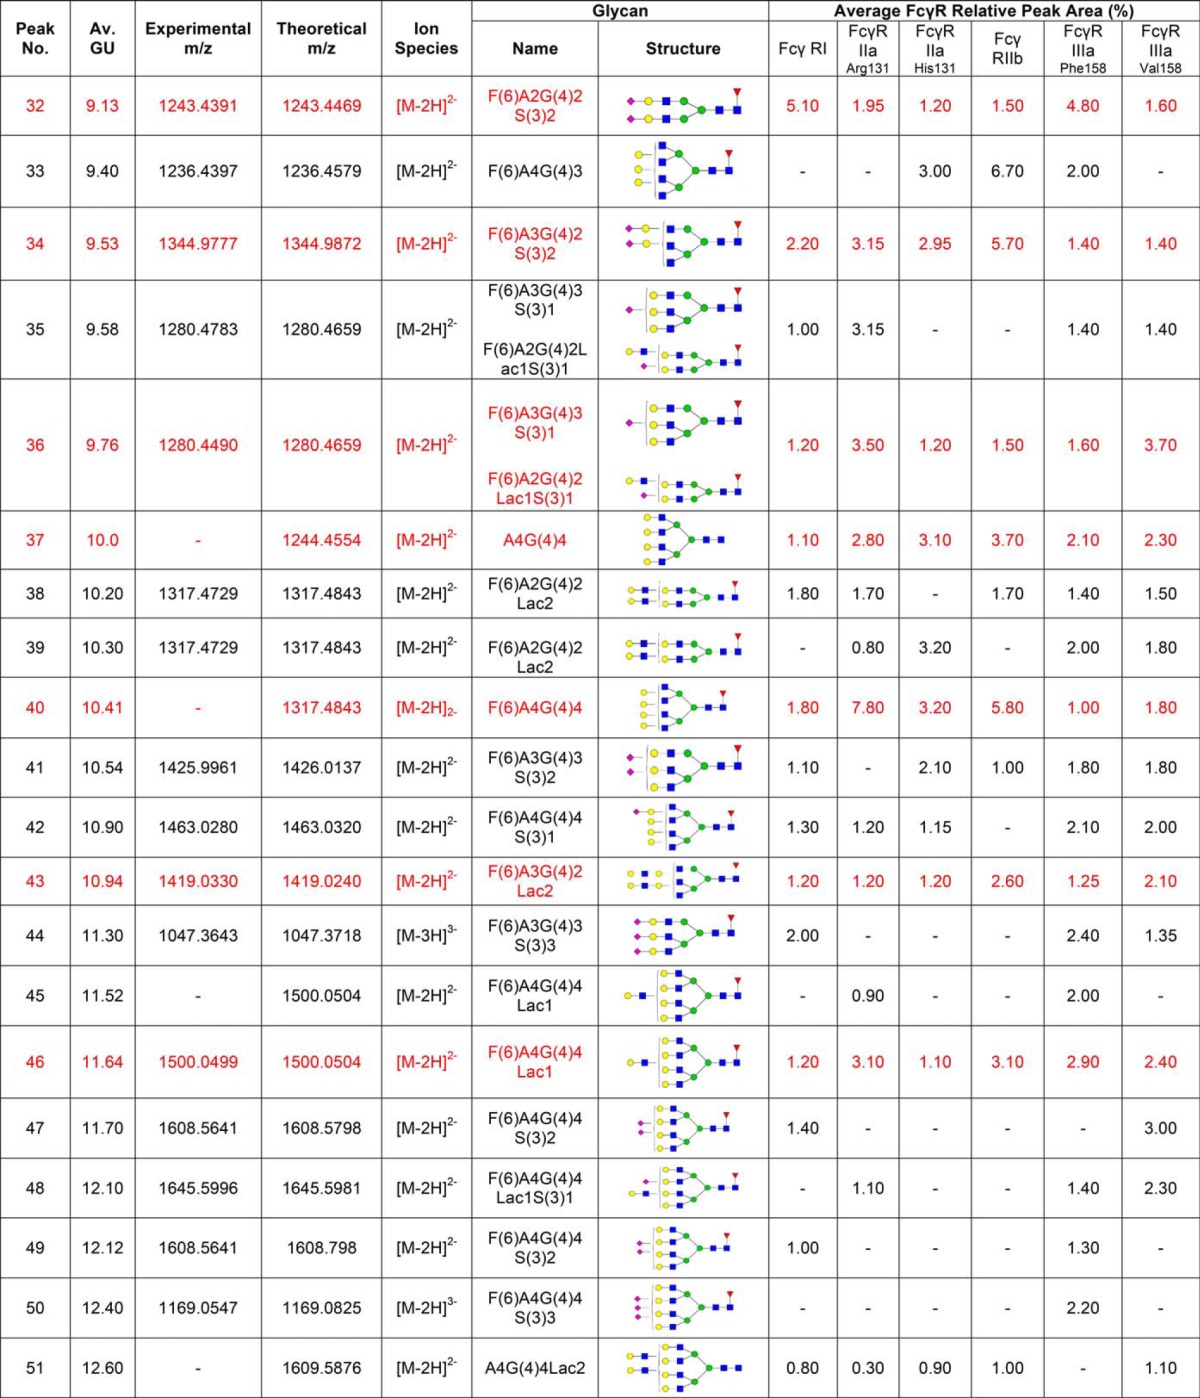
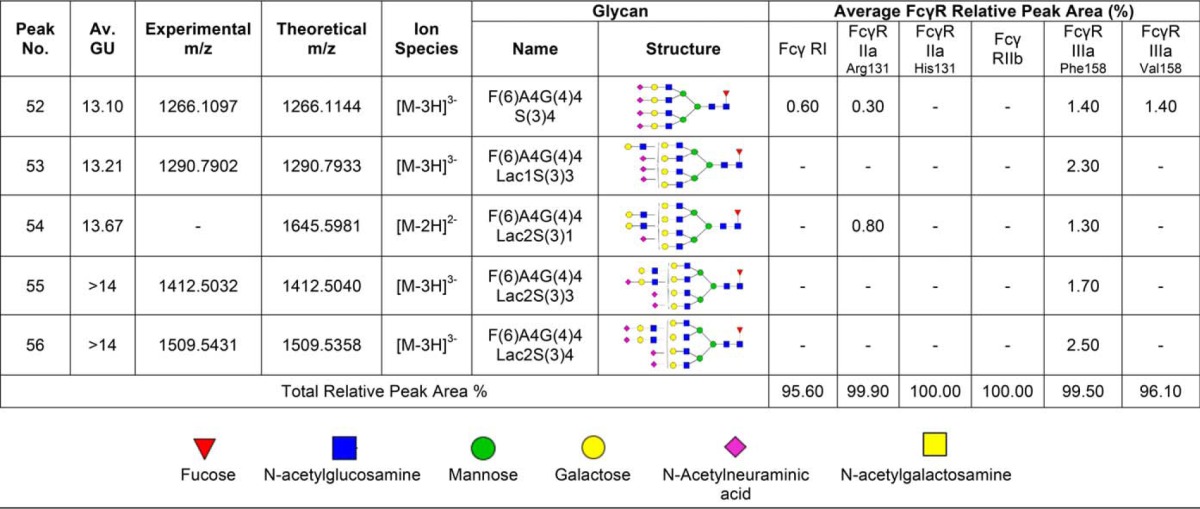
Table I. N-glycans of human FcγRs expressed in CHO cells. Glycan structures shown in red are common to each FcγR and correspond to the peaks indicated by dashed lines shown in Fig. 1A and 1B. Glycans were identified and quantified using a combination of HILIC UPLC, exoglycosidase digestions, WAX HPLC, WAX fractionation and mass spectrometry. Average GU (Glucose Unit) values and % areas are the mean of three individual glycan releases. Glycans shown in red correspond to the common glycans shown in Fig. 1. MS spectral annotation was performed using GlycoWork Bench 2.0 (33). Glycans are named according to the Oxford notation. Glycan symbols used are shown in the legend below Table I.


