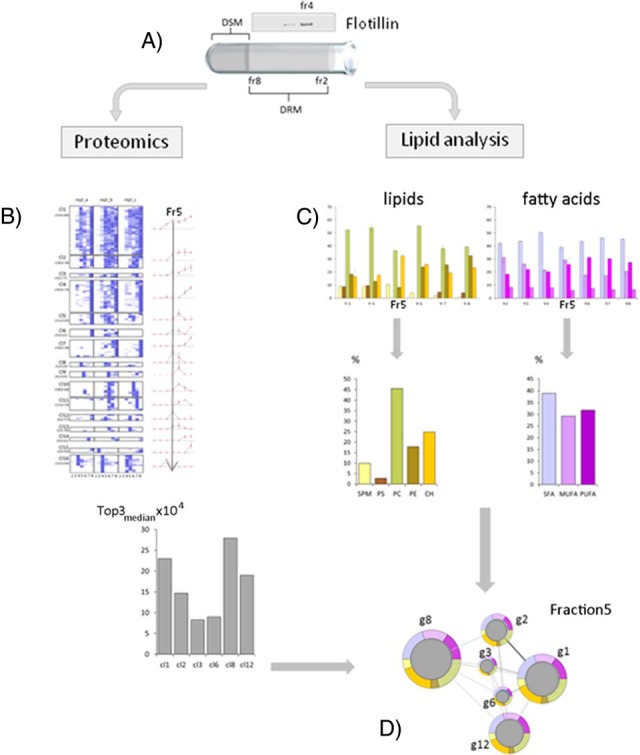
Fig. 1.

Experimental pipeline for whole-cell DRM analysis. A, Detergent-resistant membranes (DRMs) of Plasmodium-infected erythrocytes were separated from detergent-soluble membranes (DSM) by sucrose gradient centrifugation, exploiting their resistance to solubilization in cold nonionic detergents. The flotation profile of the erythrocyte raft marker Flotillin I was used as gradient control. Light fractions 2–8 were collected and subjected to proteomic or lipid analyses. Proteins detected by LC-MS/MS spectrometry in at least 2 out of 3 biological replicates were quantified (Top3 method) and quantity values in each gradient fraction exploited to generate protein abundance profiles (PAPs). To generate an overall picture of DRM buoyancy features, PAPs were grouped by a hierarchical clustering (an example is shown in Panel B). For each gradient fraction, cluster abundance was calculated as the median of abundance values of each replicate (see Experimental Procedures). Major lipid classes and fatty acid components in DRM fractions were determined by HPTLC and GC, respectively (fraction 5 is shown in Panel C). Relative abundance of sphingomyelin (SM), phosphatidylserine (PS), phosphatidylcholine (PC), phosphatidylethanolamine (PE) and cholesterol (CH), as well as the one of saturated (SFA), monounsaturated (MUFA), and polyunsatured (PUFA) fatty acids was calculated as the percentage of total amount of lipids and fatty acids detected in each gradient fraction. Relationships between protein clusters (circles) in their lipid/fatty acid context (rings), were visualized as fraction-specific multi-component networks. As an example, fraction 5 network is shown in panel D.
