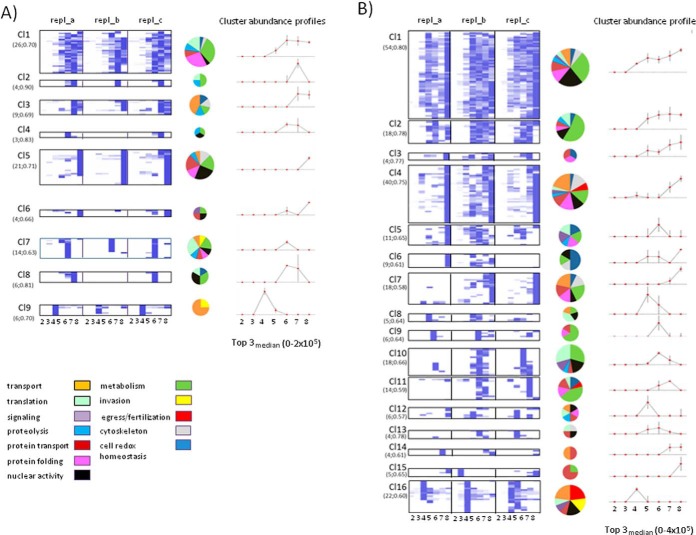
Fig. 2.
Hierarchical clustering of PAPs. Clustering of PAPs from three replicates of trophozoite (A) and mature gametocyte (B); DRMs are shown as heatmaps. Each cluster includes PAPs with Pearson's correlation coefficient higher than 0.5. The number of proteins and the minimum correlation coefficient in each cluster are reported in parentheses. Cluster abundance profiles were calculated as the median value of the replicate Top3-medians. In the case of trophozoites this value ranges from 0 to 2 × 10⁵, whereas in gametocytes the highest value is 4 × 10⁵. Vertical lines represent the standard error of the mean (S.E.). Results of the functional classification of proteins in each cluster are shown as pie charts the size of which are proportional to cluster dimensions.

