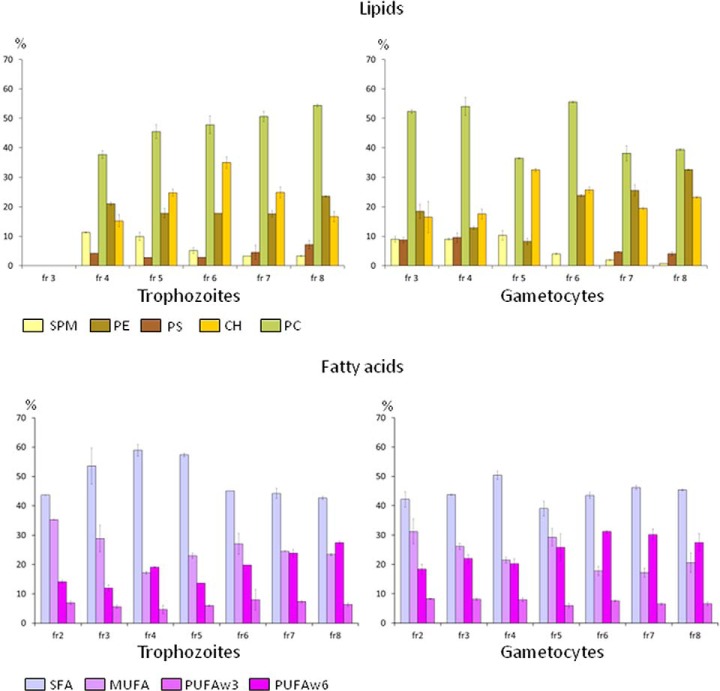
Fig. 3.
Major lipids and fatty acids in DRM containing gradient fractions. Relative abundance of lipids and fatty acid classes in each gradient fraction were calculated by dividing their abundance values by total amount of lipids and fatty acids of the same fraction. Two technical replicates were available for fatty acids and three for lipids. Vertical bars represent the mean standard errors. In the case of lipids the mean values were calculated discarding the abundance value with the highest standard deviation.

