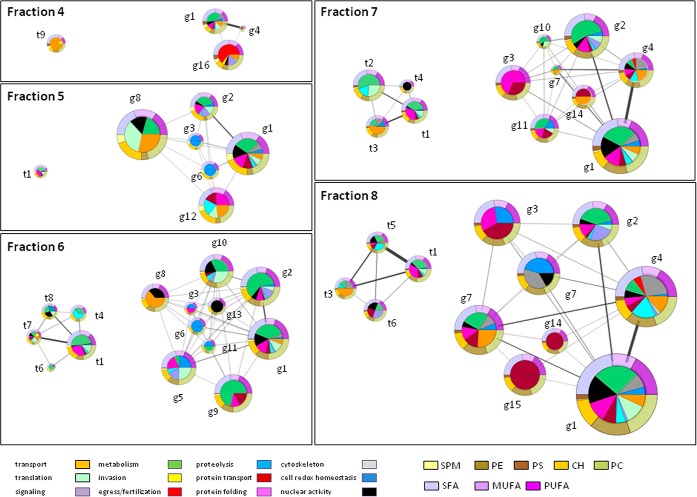
Fig. 4.
Protein/lipid co-occurrence networks. Quantitative data on protein clusters, lipids and fatty acids in DRM fractions were integrated into multi-component networks. The size of nodes (protein clusters) is proportional to their abundance in the considered gradient fraction. Each functional category of the pie charts represents the median of its abundance in the three replicates. The width of edges are proportional to the number of correlated PAPs (correlation coefficient higher than 0.5) between clusters. Each cluster is surrounded by rings that represent the lipid/fatty acid context. Relative abundances of fatty acid (SFA, MUFA and PUFA) and lipid (SM, PS, PC, PE, and CH) classes are shown in the upper and lower half rings respectively.

