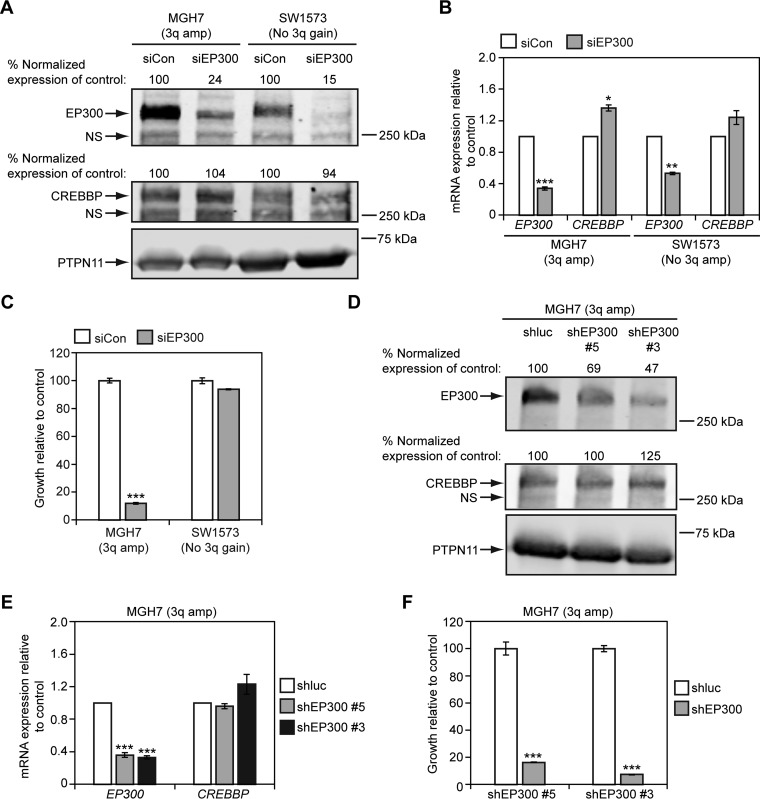
Fig. 11.
EP300 promotes growth of 3q-amplified MGH7 SQCC cells, but not non-3q-amplified SW1573 lung cancer cells. A, B, Cell lines were transfected overnight with the indicated siRNA pools (siCon = control non-EP300 targeting pool of siRNAs) and at 48 h, EP300 and CREBBP expression was quantified by Western blotting (A) and qRT-PCR (B). A, For Western blotting, protein levels were quantified by densitometry, with EP300 and CREBBP expression normalized to PTPN11 levels (loading control). Normalized EP300 and CREBBP expression was then adjusted relative to siCon-transfected cells, which was assigned a value of 100. NS = nonspecific band. B, For qRT-PCR, EP300 and CREBBP expression was normalized to levels of TBP and plotted relative to siCon, which was assigned a value of 1.0. Means ± S.E. of 3 replicates are shown. Significance was calculated using paired 2-tailed t tests between siCon and siEP300-transfected populations. Only p values ≤ 0.05 are indicated. For MGH7, ***p = 0.0005 and *p = 0.01. For SW1573, **p = 0.001. C, siEP300 inhibits growth of MGH7 cells. Cells were transfected with either an siEP300 or siCon pool in triplicate and growth quantified by alamarBlue after 5–6 days. Data are plotted relative to siCon transfected cells, which was assigned a value of 100. Means ± S.E. are shown. Significance was calculated using a 2-tailed t test between siEP300 and siCon cells. Only p values ≤ 0.05 are indicated. ***p = 4 × 10⁻⁶. D, E, shEP300 lentiviruses reduce EP300, but not CREBBP expression in MGH7 cells. Cells were infected overnight with shEP300 or shluciferase (shluc) control lentiviruses and at 24 h, selected in puromycin. At 48 h post-virus addition, EP300 and CREBBP expression was quantified by Western blotting (D) and qRT-PCR (E). D, For Western blotting, protein levels were quantified by densitometry, as described in (A). NS = nonspecific band. E, For qRT-PCR, EP300 and CREBBP expression was quantified as described in (B). Means ± S.E. of 3 replicates are shown. Significance was calculated using paired 2-tailed t tests between shluc and shEP300-infected populations. Only p values ≤ 0.05 are indicated. ***p = 0.0004 (shEP300 #5), 0.0001 (shEP300 #3). F, shEP300 lentiviruses inhibit growth of MGH7 cells. Cells were infected overnight with shEP300 and shluc control lentiviruses and selected in puromycin after 24 h for an additional 24 h. Selected cells were then seeded in replicate for growth assays. Following 7–10 days of culture, cell growth was quantified by alamarBlue. Data are plotted relative to control shluc-infected cells, which was assigned a value of 100. Means ± S.E. from triplicate cultures are shown. Significance was calculated using a 2-tailed t test. ***p = 0.0004 (shEP300 #5), 5 × 10⁻⁸ (shEP300 #3).

