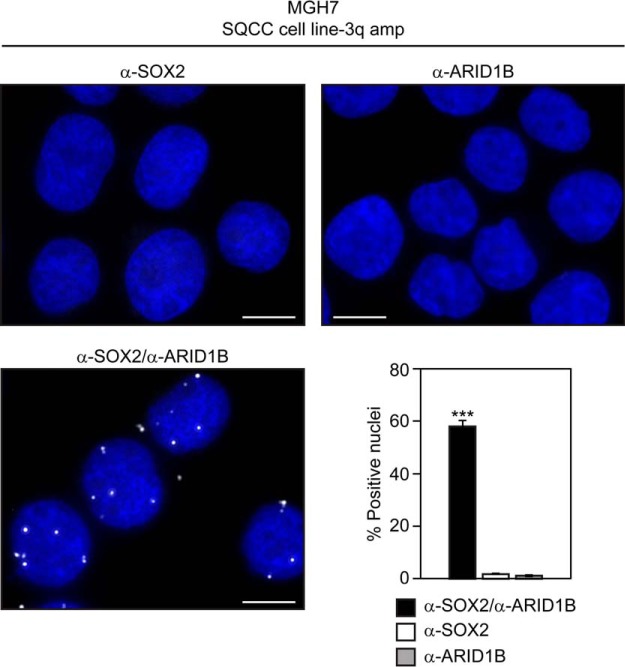
Fig. 3.
Detection of proximity between SOX2 and ARID1B in SQCC cells with 3q amplification. Cytospun MGH7 cells were fixed and subjected to the proximity ligation assay (PLA). Cells were stained with either both α-SOX2 and α-ARID1B primary antibodies, or single antibody controls. Nuclei were visualized with DAPI staining. Scale is 10 μm. Mean percentages of foci-positive nuclei ± S.E. are shown, and were calculated by scoring five fields comprising 239–582 nuclei per field. Significance was calculated using a 2-tailed t test. ***p = 8.9 × 10⁻⁹ and 8.3 × 10⁻⁹ relative to α-SOX2 alone and α-ARID1B alone, respectively, primary antibody controls.

