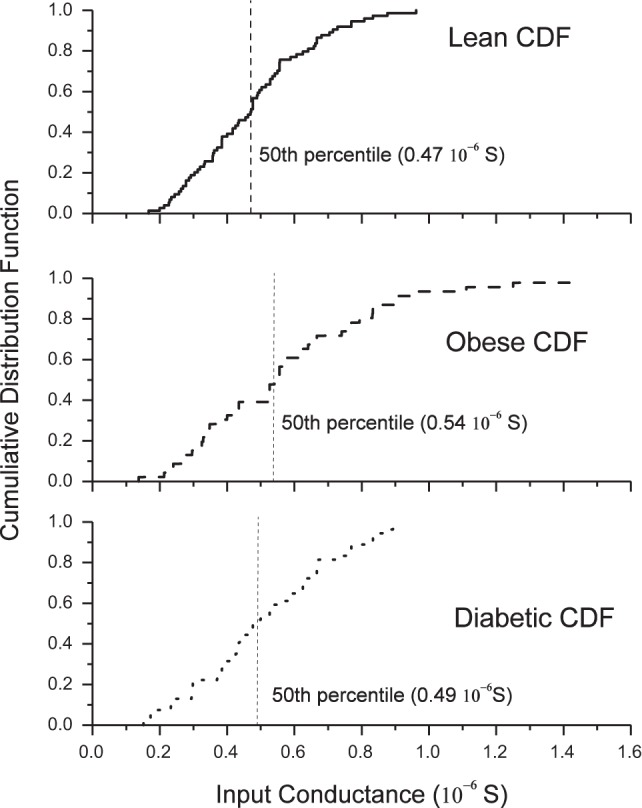
Fig. 1.

Cumulative distribution function (CDF) of input conductance (IC) for the groups. IC for lean (top), obese (middle), and diabetic groups (bottom) are shown. The 50th percentile for each group, indicated by the vertical hatched line, was used to separate motoneurons into high-input conductance (H-IC) and low-input conductance (L-IC) cells. Those motoneurons with an IC greater than the 50th percentile were designated as high-IC motoneurons. No difference existed between the distributions of IC values between each group.
