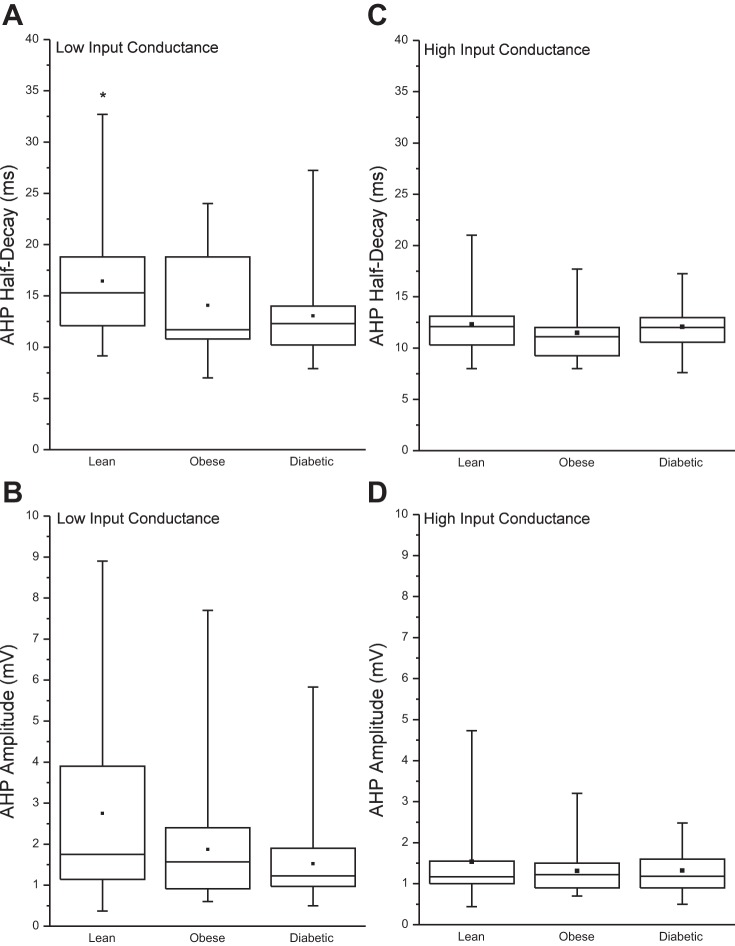
Fig. 2.
Post-spike afterhyperpolarization (AHP) amplitude and half-decay time. Data were separated into high- and low-input conductance (IC) categories according to the 50th percentile of the IC for each group (see Fig. 1). A and B: AHP half-decay time (A) and AHP amplitude (B) for the low-IC category. C and D: AHP half-decay time (C) and AHP amplitude (D) for the high-IC category. Whiskers represent the range of values, the 25th and 75th percentiles are indicated by the top and bottom of the box, and the median is the horizontal line within the box, whereas the symbol in the center indicates the mean. *P = 0.0026 denotes a significant difference from the diabetic group.

