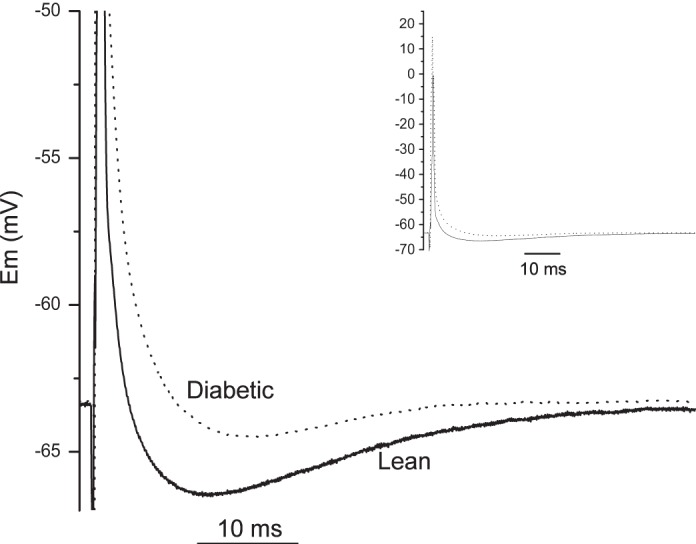
Fig. 3.

Post-spike afterhyperpolarization (AHP) comparison between lean and diabetic groups. Magnified AHP tracings are representative of the median value from the significantly different (P < 0.007) lean (solid line) and diabetic (dotted line) groups of low-conductance cells. Inset shows the full action potentials of each group (solid line, lean; dotted line, diabetic) generated from a supramaximal orthodromic depolarizing pulse (0.5 ms). Em, membrane potential.
