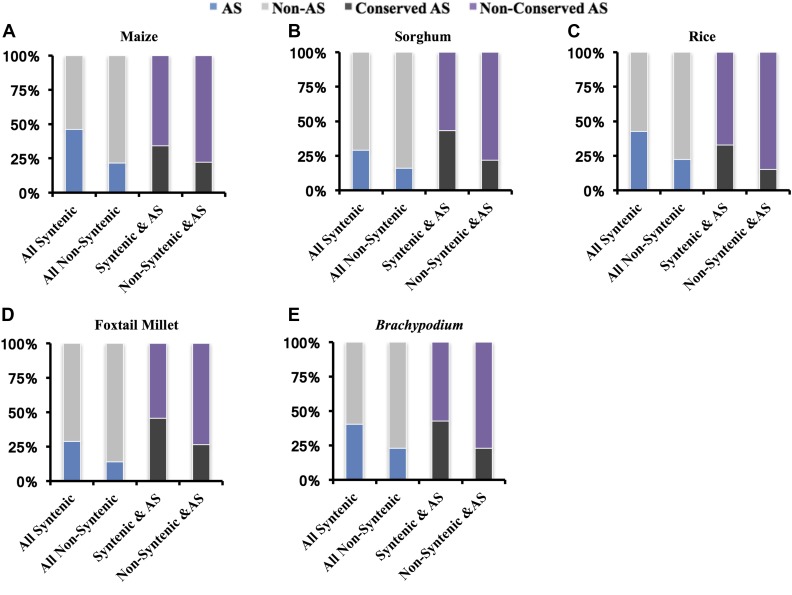
Figure 3.
AS and conserved AS enriched across grass syntenic genes in (A) maize, (B) sorghum, (C) rice, (D) foxtail millet, and (E) Brachypodium. We calculated the percentage of AS in syntenic and nonsyntenic genes (the percentage of AS genes are labeled in blue). In addition, we calculated the percentage of conserved AS in syntenic AS genes and nonsyntenic AS genes (the percentage of conserved AS genes are labeled in black).

