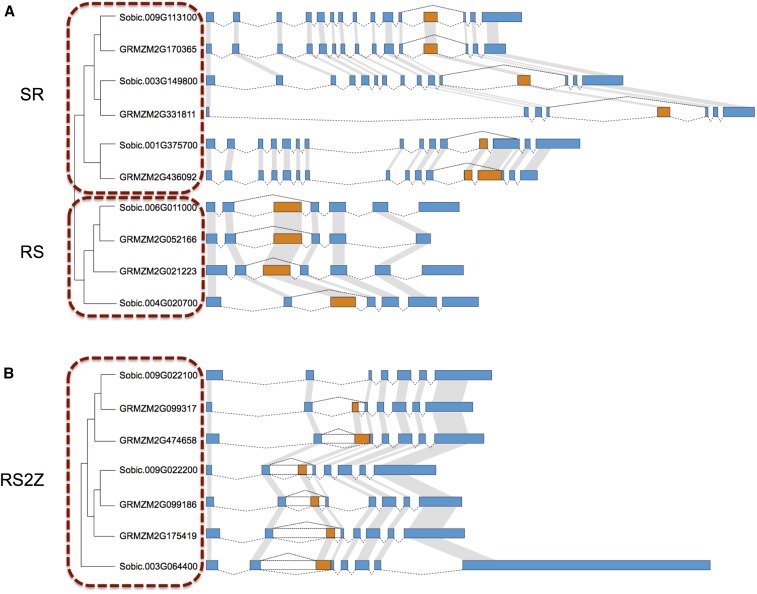
Figure 5.
Phylogenetic tree and gene structure of SR, RS, and RS2Z subfamilies in maize and sorghum. (A) Phylogenetic tree representing the relationship of genes from SR and RS subfamilies in maize and sorghum; associated gene structures are illustrated by Fancygene to the right. Constitutive exons are shaded blue, and alternative regions are indicated with orange. Transcript structure is indicated by exons connected via dashed lines; orthologous exons are indicated with gray lines. (B) Phylogenetic tree and gene structure of RS2Z subfamily in maize and sorghum are illustrated by Fancygene. Annotation and shading is described above; intron retention regions are indicated in clear boxes.

