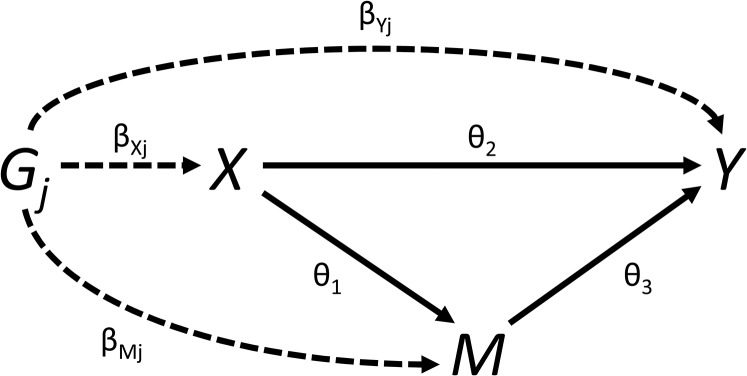
Figure 2.
Graphical diagram of relationships between risk factor (X), mediator (M), outcome (Y), and genetic variant (). Causal relationships between variables are indicated by solid lines. Associations of the genetic variant are indicated by dashed lines. The direct effect The indirect effect The total effect

