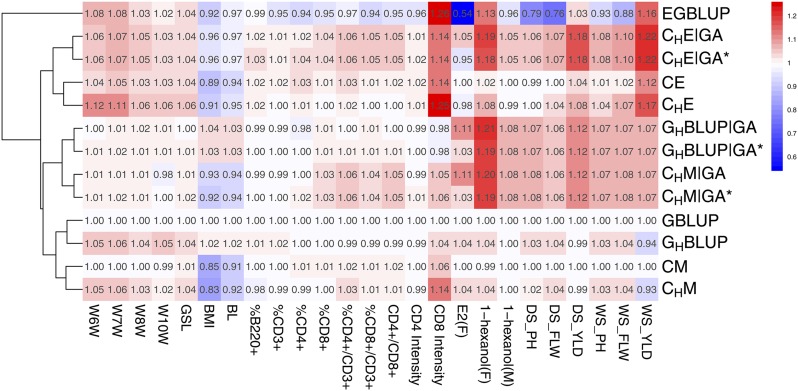
Figure 1.
Comparison of the predictive ability of different models. Rows are different models and columns are traits from three data sets. For each trait, relative predictive ability is calculated by setting as reference (mean accuracies divided by that of ). For the DGRP, only traits where gene-annotation-based models give extra predictive accuracy are presented. Trait “E2” of male lines in the DGRP data were also removed due to the extremely low predictive ability. W6W–W10W: body weight at 6 to 8 and 10 weeks; GSL: growth slope between 6 and 10 weeks of age; BMI, body mass index; BL, body length; %B220+, percentage of B220 cells; %CD3+, percentage of CD3 cells; %CD4+, percentage of CD4 cells; %CD8+, percentage of CD8 cells; %CD4+/CD3+, percentage of CD4 and CD3 cells; %CD8+/CD3+, percentage of CD8 and CD3 cells; CD4+/CD8+, ratio of CD4 to CD8 cells; CD4Intensity, CD4inCD3XGeoMean; CD8Intensity, CD8inCD3YGeoMean. F, female; M, male. DS, dry season; WS, wet season; PH, plant height; FLW, flower time; YLD, grain yield.

