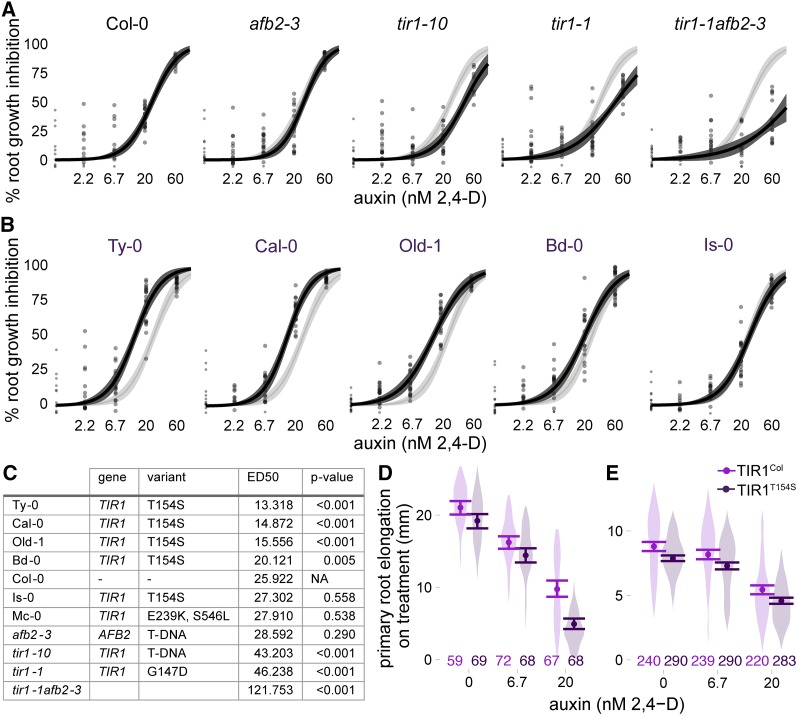
Figure 3.
Auxin sensitivity varies only subtly in wild accessions. (A and B) The impact of auxin on root growth (normalized to mock-treated controls) was measured in 8-day-old seedlings. Results from two biological replicates, each containing 10 plants per treatment level, are shown. Each measurement is shown as a transparent gray point. Solid lines represent log-logistic dose response model fits with a lighter ribbon indicating 95% confidence intervals. The Col-0 curve is reproduced in light gray in each panel to facilitate comparisons. (A) Assays on the reference accession Col-0, and mutants in the Col-0 background, are shown. (B) Auxin sensitivity of accessions containing the hypermorphic TIR1T154S allele. (C) Estimated ED50 values for selected accessions and controls. Parameters were compared ratiometrically to Col-0 and one-sample t-tests were used to estimate the likelihood that the ratio of parameters equals one. P-values were corrected for multiple testing using the Benjamini–Hochberg method. (D and E) A natural polymorphism was sufficient to alter auxin sensitivity in plants. Mean root growth (large points) and 95% confidence intervals (error bars) are shown on top of a violin plot representing the distribution of all measurements. All transgenes were expressed under the pUBQ10 promoter. The number of plants measured for each condition is shown above the x-axis. (D) Three experimental replicates were performed with T2 plants from four independent lines of Col-0 expressing the reference allele and three independent lines expressing TIR1T154S. (E) Five experimental replicates were performed with T3 plants from five independent lines of Col-0 expressing the reference allele and six independent lines expressing TIR1T154S.

