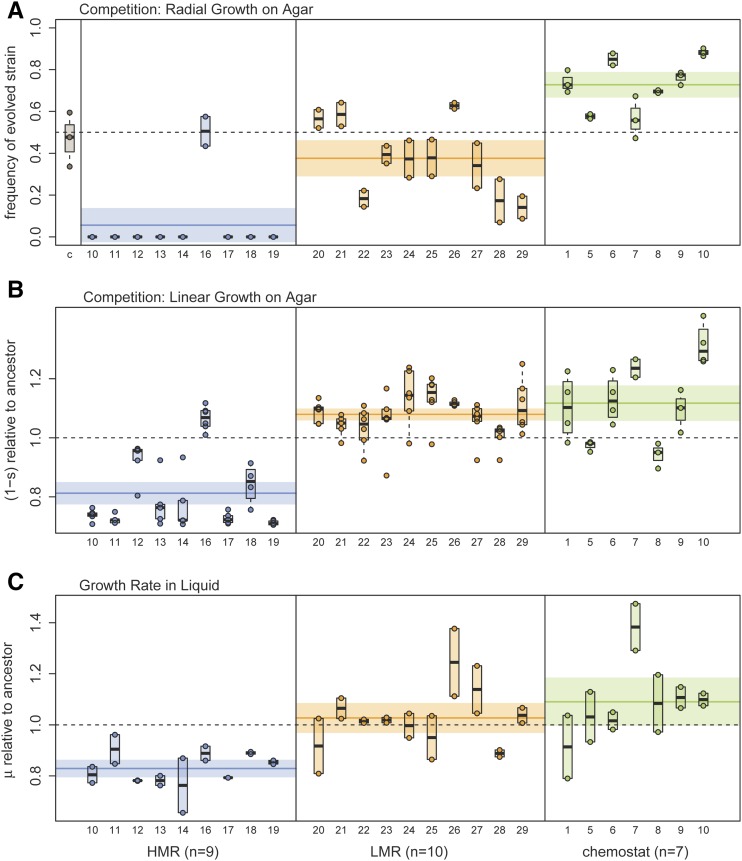
Figure 4.
Estimation of bacterial fitness. (A) Relative frequency of evolved strains on the edge of the colony after 3 days of radial growth on an agar plate, under conditions similar to those of our experiment of range expansion on agar (see Materials and Methods and Figure S5 in File S1). Note that this measure only gives a qualitative assessment of the relative fitness of two strains, as this proportion will quickly change over time in case of unequal fitness (Gralka et al. 2016b). The first column (c) of the leftmost pane represents the relative frequency of the ancestral strain containing the same plasmid as the evolved strains, showing that the incorporated plasmids do not induce any fitness difference between strains. (B) Competition on agar plate between a reference strain and evolved lines growing side-by-side for 3-days. The fitness of evolved strains (lines) is measured by the difference in growth rates at the contact zone between strains following Korolev et al. (2012). The angle formed by the contact zone between strains is indeed proportional to their fitness difference (see Materials and Methods). Each dot corresponds to one measure for a given strain. Note that the two HMR lines (12 and 16) with highest fitness both have a nonsynonymous mutation in the mlc (makes large colonies) gene. (C) Fitness of evolved strains relative to the ancestral strain, measured as growth rate in liquid culture. Note that labels on the x-axis represent line identifiers. HMR, high mutation rate; LMR, low mutation rate.

