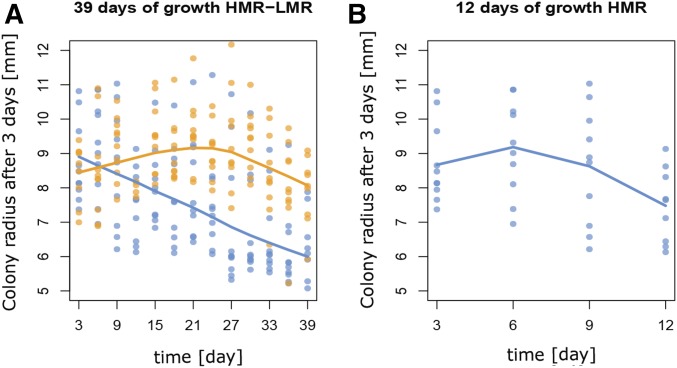
Figure 7.
Early growth dynamics of HMR and LMR lines. (A) Evolution of HMR (experiment 2) and LMR colony size after 3 days of growth over the course of the experiment. The average size of HMR colonies estimated by a LOESS regression linearly declines over time, whereas that of LMR colonies increases until day 24, and then declines until the end of the experiment. (B) Same as (A) but only for HMR lines during the first 12 days of growth, showing a pattern similar to that of LMR lines but on an ∼4× shorter timescale, which approximately corresponds to their ∼3.7× higher mutation rate (see Table S4 in File S1). HMR, high mutation rate; LMR, low mutation rate; LOESS, locally weighted scatterplot smoothing.

