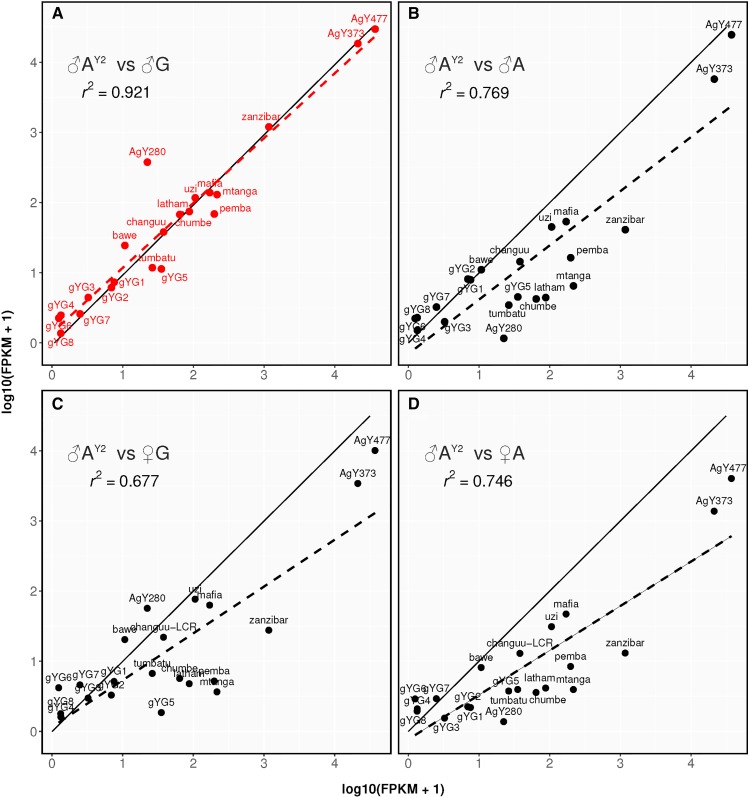
Figure 3.
Analysis of the content of the introgressed Y chromosome. The plots show the number of normalized reads mapping to the A. gambiae Y chromosome reference loci calculated as log10 transformed FPKM values for AY2 males on the x-axis compared to either wild-type A. gambiae males (A), wild-type A. arabiensis males (B), A. gambiae females (C) and wild-type A. arabiensis females (D) on the y-axis. The dashed linear regression line and associated r2 coefficient indicate the best correlation in read counts of signature Y elements between AY2 and A. gambiae males.

