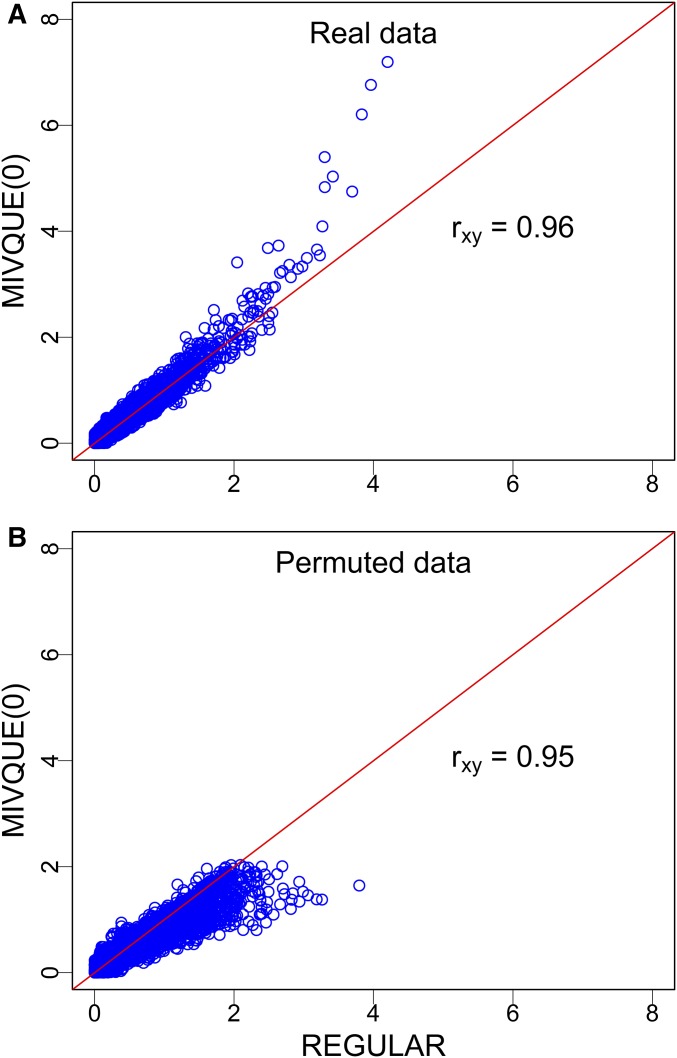
Figure 3.
Comparison of the −log10(p) test statistics of MIVQUE(0) (minimum variance quadratic unbiased estimation) with REGULAR (regularized F test) from the real data analysis (A) and from the analysis of a permuted sample (B). The Pearson correlation coefficients between the test statistics of the two methods are represented by These plots demonstrate that the test statistic of the mixed model is highly correlated with the test statistic of the regularized F test, but the patterns are different for the real data and the permuted data.

