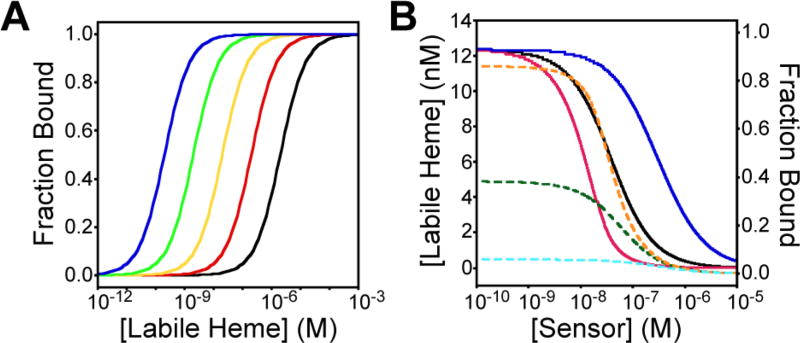
Figure 2.
Simulations of the dependence of the (A) fractional heme saturation of the sensor on labile heme concentrations and (B) observed labile heme concentration and fractional saturation of the heme sensor on sensor expression level. (A) The relationship between labile heme concentration and fractional heme saturation of the sensor is shown for sensors with heme dissociation constants of 2000 nM (black), 200 nM (red), 20 nM (yellow), 2 nM (green), and 0.2 nM (blue). Optimal heme sensing is achieved when the Kd of the heme sensor is similar to the concentration of labile heme. The simulation is based on the model depicted in eqs 1–3. (B) Dependence of the observed sensor fractional saturation (dashed lines) and the concentration of labile heme (solid lines) on sensor expression. The simulations were conducted using Hyperquad Simulation and Speciation HySS 2009, assuming a hypothetical competition between the heme sensor and a cellular heme buffer, present at 20 nM and having a heme KD value of 20 nM, for 20 nM heme. Simulations are shown for three sensors with KD values of 2 nM (orange and red), 20 nM (green and black), and 200 nM (light blue and dark blue).

