
Figure 2.
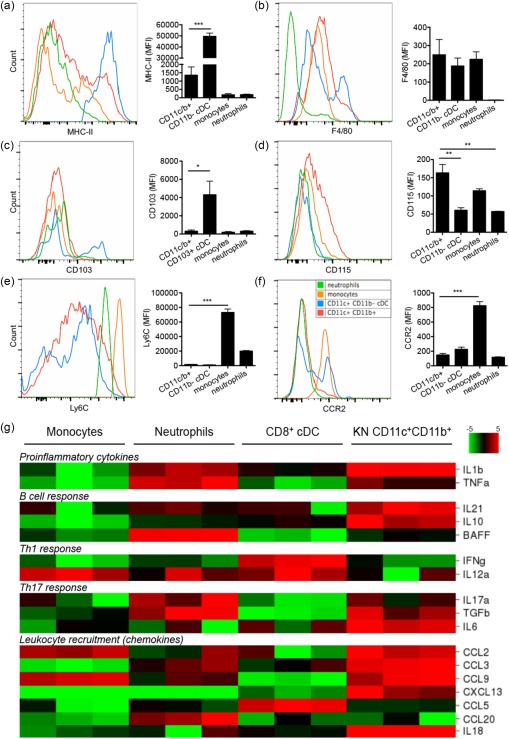
Phenotype and cytokine/chemokine profile of renal‐infiltrating CD11c+ cells. (a–f) The surface mean fluorescent intensity (MFI) of (a) major histocompatibility complex (MHC)‐II, (b) F4/80, (c) CD103, (d) CD115, (e) Lymphocyte antigen 6 complex (Ly6C) and (f) CCR2 on renal‐infiltrating CD11c+ cells (CD11c+CD11b+, red), CD11b–conventional dendritic cells (cDCs) (defined as CD11c+CD11b–MHC‐II+, blue), monocytes (defined as CD11c–CD11b+Ly6ChighSSC‐Hlow, orange) and neutrophils (defined as CD11c–CD11b+Ly6CmidSSC‐Hhigh, green) from 4‐month‐old Murphy Roths large (MRL)/lpr mice as determined by flow cytometry. Representative flow cytometry histograms are shown. *P < 0·05; **P < 0·01; ***P < 0·001, one‐way analysis of variance (anova). Data are shown as mean ± standard error of the mean (s.e.m.), n = 3 mice in each group. (g) Relative transcript levels of selected cytokines and chemokines as determined by reverse transcription–quantitative polymerase chain reaction (RT–qPCR) in bone marrow monocytes [4',6‐diamidino‐2‐phenylindole (DAPI)–CD11c–CD11b+CD115+Ly6Chigh], bone marrow neutrophils (DAPI–Ly6G+CD11b+), splenic CD8+cDCs (DAPI–CD11b–CD11c+CD8+MHC‐II+) and kidney (KN)‐infiltrating CD11c+ cells (DAPI–CD45+Lin–CD11c+CD11b+) sorted from 4‐month‐old MRL/lpr mice. A heat‐map is shown. Red, higher expression level; green, lower expression level; n = 3 mice in each group. [Colour figure can be viewed at wileyonlinelibrary.com]