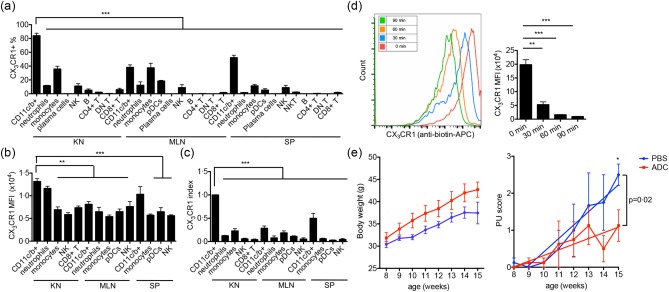
Figure 4.

The pathogenic role of renal‐infiltrating CD11c+ cells in vivo. (a,b) The percentage of CX3CR1+ cells (a) and the mean fluorescent intensity (MFI) of CX3CR1 in the CX3CR1+ subpopulation (b) in each type of leucocytes from the kidney (KN), mesenteric lymph node (MLN) and spleen (SP) of 4‐month‐old MRL/lpr mice as determined by flow cytometry. (c) CX3CR1 expression index calculated as [(%CX3CR1+)cell type × (CX3CR1 MFI)CX3CR1+ part of cell type]/[(%CX3CR1+)renal CD11c+ cells × (CX3CR1 MFI)CX3CR1+ part of renal CD11c+ cells]. (d) Internalization of surface CX3CR1 by renal‐infiltrating CD11c+ cells from 4‐month‐old Murphy Roths large (MRL)/lpr mice as determined by flow cytometry. Cells were stained with anti‐mouse CX3CR1‐biotin and cultured for different periods of time at 37°C, followed by staining with anti‐biotin‐allophycocyanin (APC). A representative flow cytometry histogram is shown. (e) Body weight (left) and proteinuria (PU) scores (right) of antibody–drug conjugate (ADC)‐ (red) or phosphate‐buffered saline (PBS)‐ (blue) treated MRL/lpr mice. Mice were treated from 8 to 15 weeks old. *P < 0·05 **P < 0·01; ***P < 0·001, one‐way analysis of variance (anova) or linear regression. Data are shown as mean ± standard error of the mean (s.e.m.), n ≥ 3 mice in each group. [Colour figure can be viewed at wileyonlinelibrary.com]
