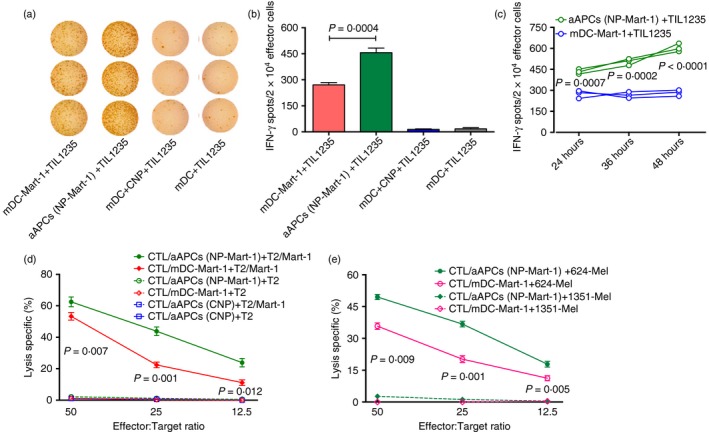
Figure 3.

Artificial antigen‐presenting cells (aAPCs) (NP‐Mart‐1) are superior to mature dendritic cells (mDCs) ‐Mart‐1 when presenting antigen and inducing cytotoxic T‐lymphocyte (CTL) response. ELISpot and cytotoxicity assays were performed to assess the Mart‐1 antigen presentation and CTL cytotoxic activities. Both the ELISpot and cytotoxicity assays were independently repeated three times, and each condition was performed in triplicate. (a) Representative ELISpot images. (b) Comparison of the Mart‐1 antigen presentation between mDC‐Mart‐1 and aAPCs (NP‐Mart‐1) using the ELISpot assay. Empty aAPCs (mDCs + CNPs) and mDCs were also included as the controls. Significantly more Mart‐1 antigen was presented to the TIL 1235 cells by the aAPCs (NP‐Mart‐1) than by the mDC‐Mart‐1 (P = 0·0004). (c) aAPCs presented antigen to T cells in a sustained manner. ELISpot assays were performed at different incubation times of 24, 36 and 48 hr. Interferon‐γ (IFN‐γ) spots in the aAPC group were more significant than those in the peptide‐pulsed mDCs group at the above incubation time‐points (P < 0·001). (d) The Mart‐1‐specific CTLs generated by both aAPCs (NP‐Mart‐1) and mDC‐Mart‐1 were capable of lysing Mart‐1 peptide‐pulsed T2 cells [solid green line and solid red line in (c)]. The cytotoxic activity of the CTLs generated with the aAPCs (NP‐Mart‐1) was significantly higher than that of the CTLs generated with mDC‐Mart‐1 (P values of 0·007, 0·001 and 0·012 for the E : T ratios of 50 : 1, 25 : 1 and 12·5 : 1, respectively). (e) The Mart‐1‐specific CTLs generated by both aAPCs (NP‐Mart‐1) and mDC‐Mart‐1 were also able to lyse melanoma 624 cells [solid green line and solid pink line in (e)]. The cytotoxic activity of the CTLs generated with aAPCs (NP‐Mart‐1) was significantly higher than that of the CTLs generated by mDC‐Mart‐1 (P values of 0·009, 0·001 and 0·005 for the E : T ratios of 50 : 1, 25 : 1 and 12·5 : 1, respectively). In addition, the CTLs induced by aAPCs (CNPs) were also included as a control, and the results showed that they failed to recognize and kill the target cells of both T2 cells and Mart‐1 peptide‐pulsed T2 cells [solid and broken blue lines in (d)]. Each assay was independently repeated three times, and each condition was performed in triplicate. [Colour figure can be viewed at wileyonlinelibrary.com]
