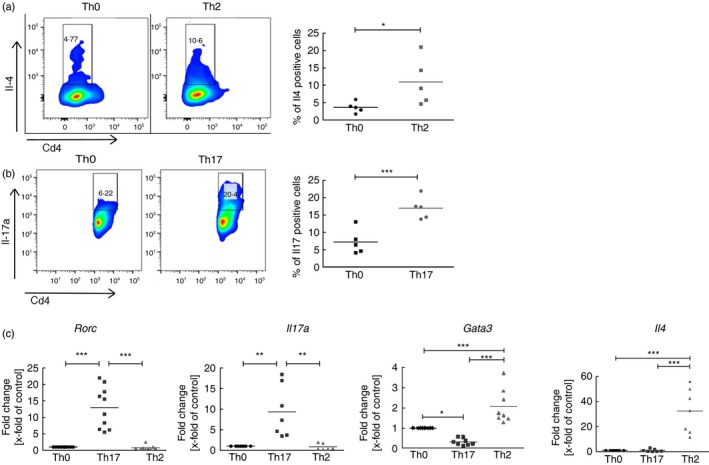
Figure 1.

Characterization of primary, in‐vitro‐differentiated T helper cells. (a) Protein expression of the Th2 effector cytokine interleukin‐4 (Il‐4). Depicted are representative flow cytometry density blots for Il4 and Cd4. Numbers are positive counted cells in %. n = 5 independent experiments are summarized in the dot blot on the right column. (b) Protein expression of the Th17 effector cytokine Il‐17a. Depicted are density blots for Il17a and Cd4. n = 5 independent experiments are summarized in the dot blot on the right column. (c) Gene expression of major transcription factors and effector cytokines of Th17 cells and Th2 cells. Depicted are dot blots of fold changes compared with the control (Th0) and normalized to Hprt. Medians in dot blots are represented by a black line. For (a) and (b) significant differences between Th0 control cells and Th17 or Th2 cells were calculated with Student's t‐test. For (c) statistical differences were calculated with one‐way analysis of variance and Tukey post‐test. *P < 0·05, **P < 0·01,***P < 0·001.
