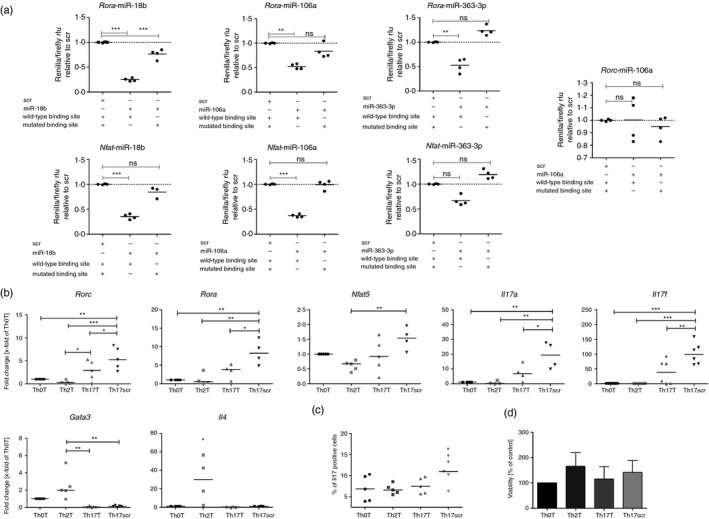
Figure 5.

Target gene validation for microRNA (miRNA) 106a‐5p, 18b‐5p and 363‐3p and function in T helper cells. (a) Luciferase reporter assay with plasmids containing either wild‐type or mutated miRNA binding sites. Depicted are the luciferase values (Renilla/Firefly) relative to the scrambled negative control. (b) Quantitative RT‐PCR analysis of transfected T helper subsets. Cells were simultaneously transfected with 6·5 nM miRNA 106, 18b and 363 (Th0T, Th2T and Th17T) or the same concentration of a scrambled miRNA (Th17scr). Depicted are fold changes compared with the transfected Th0T subset and normalized to the expression of Hprt. (c) Flow cytometry analysis of interleukin‐17 (Il‐17) protein production of transfected T helper cells. (a–c) Medians are depicted of four to six independent experiments. (d) Viability (MTT assay) of T helper cells after transfection. Shown are the mean (± SD) relative amounts of viable cells compared with the control (n = 4). Differences are not significant. Statistical differences were calculated with one‐way analysis of varaince and Tukey post test. *P < 0·05, **P < 0·01, ***P < 0·001, ns = non‐significant.
